
When investors hunt for ways to play the artificial intelligence boom, they instinctively reach for chipmakers, hyperscalers, and power utilities. Almost nobody thinks about the pipeline sitting underground that actually moves the fuel to keep those AI data centers running. That blind spot is exactly where Williams Companies (NYSE: WMB) — the largest natural gas infrastructure operator in the United States — has quietly become one of the most compelling “picks-and-shovels” ways to own the data-center electricity supercycle.
The catalyst that crystallized this Williams Companies data center natural gas thesis is the Socrates project in New Albany, Ohio. In June 2025, the Ohio Power Siting Board greenlit a Williams-backed, roughly 400-megawatt off-grid gas power complex built specifically to feed Meta Platforms’ expanding data-center campus. Williams is investing about $1.6 billion, backed by a 10-year fixed-price supply agreement with an option for a five-year extension. Electricity is scheduled to flow by the third quarter of 2026. For a midstream company that has historically been valued as a slow-growth, dividend-paying toll-road operator, Socrates is the tangible proof point that WMB has found a genuine growth engine — one where a hyperscaler signs a decade-long contract and Williams books high-return, inflation-protected cash flows.
This article makes three core arguments. First, the AI-driven surge in U.S. electricity demand, combined with a doubling of LNG exports by 2030, is structurally lifting natural gas volumes — and Williams owns the Transco pipeline system, which alone delivers roughly 15% of all natural gas consumed in the country, giving it an unrivaled position to capture that demand. Second, Williams is layering a genuine, contracted power-generation growth business on top of its stable fee-based transmission franchise, a shift the market is only beginning to reward. Third, even after a strong run, WMB trades at a forward multiple that — while a premium to legacy midstream peers — is defensible given a Strong Buy analyst consensus, a consensus price target of $84.43 implying roughly 12% upside from the current $75.45, and a durable ~2.9% dividend that keeps compounding while you wait.
Over the next several sections, we will break down Williams’ business model and segment economics, take a deep dive into the natural gas infrastructure industry and its AI-and-LNG demand drivers, dissect the company’s economic moat, walk through its financials, build a valuation with bull/base/bear scenarios, catalog the key risks, and finish with a concrete rating and exit plan.
—
1. Company Overview
Williams Companies is a Tulsa, Oklahoma-based energy infrastructure company founded in 1908. Today it is the dominant natural gas midstream operator in North America, handling roughly a third of the natural gas that flows through the United States on any given day across its gathering, processing, transmission, and storage network. Crucially, Williams is not an oil-price bet: the vast majority of its cash flow is fee-based, meaning it earns money on the volume of gas that moves through its pipelines rather than on the commodity price of that gas. This gives WMB a utility-like cash-flow profile with far less commodity exposure than an exploration-and-production company.
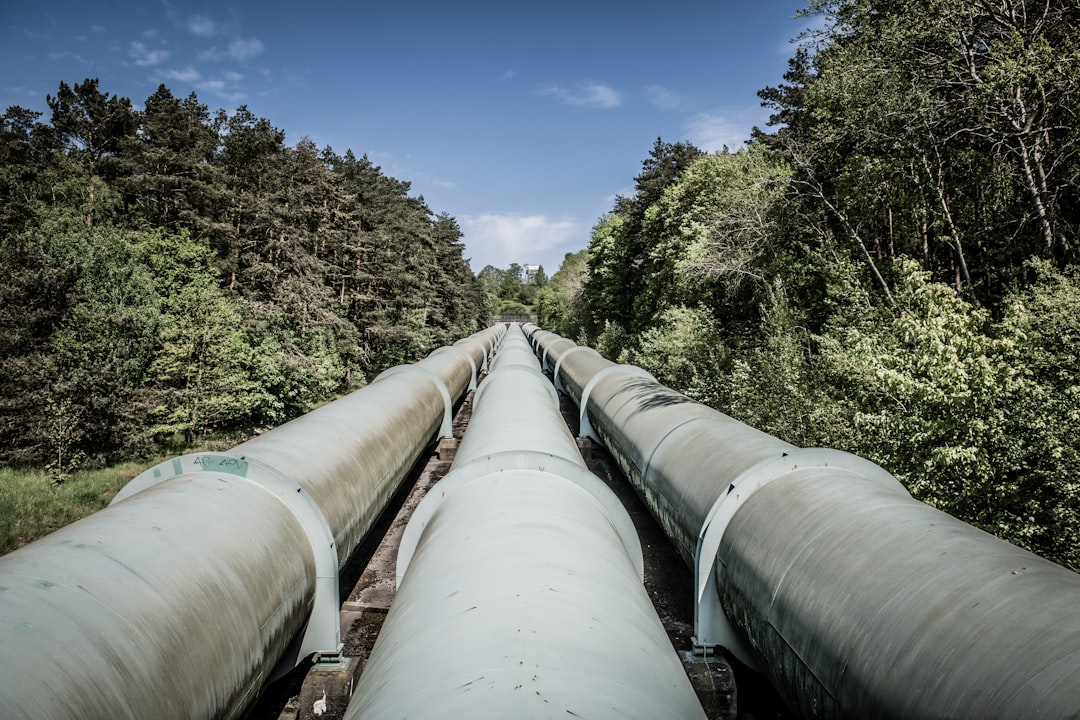
How Williams makes money. The company’s crown jewel is Transco (Transcontinental Gas Pipe Line), a roughly 10,000-mile pipeline system that runs from the Gulf Coast up through the Southeast and into the densely populated Northeast markets. Transco is the largest-volume natural gas transmission system in the country and, by the company’s own disclosures, delivers roughly 15% of the natural gas consumed in the United States. Williams earns long-term, take-or-pay style transportation fees on Transco’s capacity, and it has a multi-year backlog of expansion projects — brownfield additions to existing pipe that carry lower risk and attractive returns.
Segment breakdown. Williams reports across several operating segments, and the illustrative revenue/EBITDA mix below is drawn from its recent disclosures. Exact figures shift quarter to quarter, but the shape is stable: transmission and the emerging power business anchor the profit pool.
Segment What it does Share of adj. EBITDA (approx.) Transmission & Gulf of Mexico (incl. Power) Interstate pipelines (Transco, Northwest), storage, deepwater, new power generation ~45–50% Northeast G&P Gathering & processing in Marcellus/Utica shale ~25% West Gathering, processing in Rockies, Barnett, Haynesville ~18% Gas & NGL Marketing Services Trading/optimization of gas and natural gas liquids ~5–8%
The key takeaway is that the majority of profit comes from regulated or long-term-contracted transmission assets — the most defensive, predictable part of the energy value chain — while the new power-generation initiatives (Socrates being the flagship) sit inside the Transmission & Gulf segment as a growth overlay.
Customers, market position, and governance. Williams’ customer base reads like a who’s-who of the American economy: local gas distribution utilities, electric power generators, industrial users, LNG export terminals, and — increasingly — hyperscale data-center operators like Meta. Its competitive position is defined by scale and irreplaceable geography; you cannot simply build a second Transco. On governance, Williams is a widely held, S&P 500 large-cap with a market capitalization of $92.28 billion and approximately 1.22 billion shares outstanding. Institutional ownership dominates the register, as is typical for a large-cap dividend payer, and the company has a long, consistent record of returning capital to shareholders through a growing dividend currently yielding roughly 2.9%.
—
2. Industry Analysis
The investment case for Williams cannot be understood without understanding the extraordinary shift underway in U.S. natural gas demand. For a decade, the midstream narrative was one of flat-to-declining domestic gas consumption, energy-transition headwinds, and capital discipline. That narrative has been turned on its head by two simultaneous demand shocks — data centers and LNG exports — that together are creating the most significant natural gas demand tailwind in a generation.
2-1. Market Size & Growth Trajectory
Start with the demand math. According to the U.S. Energy Information Administration and multiple industry analyses, total U.S. natural gas demand is projected to increase roughly 25% by 2030 relative to 2024, reaching approximately 138 billion cubic feet per day (Bcf/d). Nearly 60% of that growth is expected to come from LNG exports, with the remainder driven by domestic power generation — and increasingly, data centers. This is not a modest cyclical uptick; it is a structural step-change in a commodity market that many investors had written off as ex-growth.
To physically move that gas, the industry needs new pipe. Roughly 62 Bcf/d of new pipeline capacity is projected to enter service between 2026 and 2030 — new takeaway lines, brownfield expansions, and “middle-mile” infrastructure. And here is the critical point for Williams: if pipeline and storage development lags demand growth, bottlenecks and price spreads widen, which increases the value of already-in-the-ground capacity. The owner of the incumbent network — Williams — is positioned to benefit whether the industry builds fast enough or not.
In terms of where the industry sits in its cycle, natural gas infrastructure is transitioning from a mature, low-growth phase into a renewed acceleration phase driven by these two demand engines. That is an unusual and valuable setup: the durability and cash-flow stability of a mature industry, combined with the volume growth of an emerging one.
2-2. Structural Growth Drivers
Driver 1 — The data-center electricity supercycle. The single most important new demand source is artificial intelligence. By 2030, the U.S.’s rapidly developing AI-driven data-center industry could consume over 10% of U.S. electricity, up from roughly 4% today. Of the nearly 250 terawatt-hours of projected new electricity generation needed for data centers by 2030, natural gas is expected to supply the largest single share — on the order of 130 TWh. Translated into gas volumes, data-center natural gas demand alone may reach 6.1 Bcf/d by 2030. Why gas and not renewables? Because data centers require firm, around-the-clock, dispatchable power that solar and wind cannot reliably provide on their own, and because grid interconnection queues stretch for years. Gas turbines can be built faster and run continuously, which is precisely why Meta partnered with Williams for an off-grid, behind-the-meter solution at Socrates — bypassing the congested grid entirely. This driver is long-term in nature: data-center buildout plans extend well into the 2030s.
Driver 2 — The LNG export doubling. The second engine is liquefied natural gas exports. U.S. LNG exports are on track to soar from a record 11.9 Bcf/d in 2024 to roughly 21.5 Bcf/d by 2030, according to EIA projections — effectively a doubling. New LNG capacity additions will demand roughly three times as much gas as new gas-fired power plants serving data centers, highlighting LNG’s outsized impact on total gas demand. Because Transco runs directly through the Gulf Coast LNG corridor, Williams is geographically positioned to feed these export terminals, capturing incremental transportation volumes as facilities ramp. This is both a near-term (facilities coming online now through 2027) and long-term (through-2030 buildout) dynamic.
Driver 3 — Coal retirements and grid electrification. Beneath the two headline drivers sits a slower but persistent tailwind: the continued retirement of coal-fired power plants and the broad electrification of the economy (EVs, industrial reshoring, heat pumps). As coal capacity comes offline, natural gas remains the primary firm, low-carbon-relative-to-coal replacement for baseload generation. This steadily lifts the baseline of domestic gas-fired power burn, independent of the AI and LNG stories, and reinforces the multi-decade demand floor under Williams’ transmission volumes.
2-3. Competitive Landscape
Williams operates in an oligopolistic industry defined by a handful of scaled midstream operators. The table below compares the major players on the metrics that matter for a pipeline franchise.
Company Approx. Market Cap Core Asset Base Key Moat Williams (WMB) ~$92B Transco + Northwest pipelines, NE G&P Largest US gas transmission system (~15% of US gas via Transco) Kinder Morgan (KMI) ~$60B Large gas + product pipelines Broad footprint, Texas intrastate Enbridge (ENB) ~$95B Liquids + gas, heavily Canadian Largest liquids network in N. America ONEOK (OKE) ~$55B NGL-focused, gathering/processing NGL logistics scale
Williams’ distinctive edge is its pure-play exposure to natural gas transmission at the Gulf-Coast-to-Northeast axis — the exact geography where both LNG export demand and Northeast power demand concentrate. Whereas Enbridge is more liquids-and-Canada weighted and ONEOK is NGL-centric, Williams sits at the epicenter of the U.S. gas demand story. Equally important, Williams has moved early and aggressively into behind-the-meter power generation for data centers, giving it a differentiated growth vector its transmission peers have been slower to pursue. In an industry where you cannot simply replicate a competitor’s right-of-way, incumbency at the right geography is the whole game — and Williams holds one of the strongest hands.
—
3. Economic Moat Analysis
Williams possesses one of the widest and most durable moats in the entire energy sector. Its competitive advantages fall into two reinforcing categories: efficient scale and switching costs / cost advantage rooted in irreplaceable physical assets.
Moat Type 1: Efficient Scale and Irreplaceable Assets
Pipeline networks are the textbook example of an efficient-scale moat. Building a large interstate natural gas pipeline requires securing thousands of miles of contiguous right-of-way, navigating a multi-year federal permitting gauntlet (FERC approvals, environmental review, eminent domain), and committing billions of dollars of capital before a single molecule flows. The Transco system, assembled over decades, simply cannot be recreated by a new entrant at anything approaching a rational cost. This is why Transco moves roughly 15% of all natural gas consumed in the United States and why that share is structurally protected — a competitor would need to spend tens of billions and wait a decade to challenge it, with no guarantee of securing the permits.
The concrete evidence of this moat is in the returns and the contract structure. Williams generates a return on equity of 21.92% and operating margins north of 37% — figures that are the hallmark of an entity earning economic rents from an asset that cannot be competed away. Its expansion projects are predominantly brownfield additions to existing rights-of-way, which carry lower permitting risk and higher incremental returns than greenfield builds. The moat is not theoretical; it shows up directly in the margin structure and the reinvestment economics.
Moat Type 2: Switching Costs and Long-Term Contracts
Layered on top of the physical moat is a contractual one. Williams’ revenue is overwhelmingly fee-based and secured through long-term, take-or-pay transportation agreements. Once a utility, power generator, or LNG exporter has contracted for capacity on Transco and physically connected its facilities, switching to an alternative pipeline is enormously costly and often physically impossible — there simply isn’t a competing line running to the same location. This produces extraordinarily sticky, recurring revenue with high customer retention and pricing power that resets with inflation.
The Socrates/Meta arrangement is the newest and most vivid demonstration of these switching costs. A hyperscaler willing to sign a 10-year fixed-price supply agreement with an option for a five-year extension, and to build its multi-billion-dollar data center around Williams-supplied power, is locking itself into a 10-to-15-year relationship. That is the definition of switching costs and pricing durability — Meta cannot easily unplug and re-source its baseload power once the campus is built around it.
Moat Durability Assessment
Will this moat hold over the next 5–10 years? On balance, yes — with clear-eyed acknowledgment of the risks. The primary long-term threat is the energy transition: if grid-scale renewables plus batteries, or advanced nuclear (SMRs), become cheap and reliable enough to displace firm gas generation for data centers, the incremental growth thesis weakens. However, two counterarguments give the moat staying power. First, the transmission franchise (moving gas that already has demand) is far more durable than any single end-market; even in an aggressive decarbonization scenario, gas remains the backbone of firm power and industrial feedstock well into the 2030s and 2040s. Second, the near-to-medium-term physics are unambiguous: data centers need firm power now, grid interconnection is gridlocked, and gas is the only technology that can be deployed at the required scale and speed this decade. The moat around Williams’ existing network is essentially unbreachable; the only real debate is the growth rate of new contracted volumes, not the durability of the base.
—
4. Financial Analysis
Williams’ financial profile marries the stability investors expect from a regulated-utility-like business with an accelerating growth trajectory that is new to the story. The company just reported record results and raised guidance, underscoring the operational momentum.
Revenue and earnings trend. The multi-year picture below shows revenue reaccelerating after a soft 2024, driven by higher transmission volumes and expansion projects coming online.
Year Revenue YoY Change Note FY2023 $10.91B -0.5% Flat; lower commodity marketing FY2024 $10.50B -3.7% Trough year; commodity price drag FY2025 $11.95B +13.8% Record year; expansion projects ramp TTM (mid-2026) $12.13B — Continued volume growth
The 2024 dip was largely a function of lower commodity marketing revenue (a low-margin, pass-through line), while the underlying fee-based transmission business kept growing. The 2025 rebound to a record $11.95 billion — up 13.8% — reflects the inflection point where new demand began translating into new volumes. On a trailing-twelve-month basis, revenue stands at $12.13 billion, net income at $2.79 billion, and the company converts those revenues into a 22.99% net profit margin, a 37.24% operating margin, and a 43.17% gross margin — margins that would be the envy of most industrials and that reflect the toll-road economics of the pipeline model.
Profitability and returns. Williams’ return on equity of 21.92% and return on assets of 4.88% (the latter naturally lower given the enormous fixed-asset base) demonstrate that management is earning strong returns on the capital deployed into its network. Trailing EPS is $2.28, and the consensus forecast for next year rises to $2.53 — implying roughly 11% earnings growth as expansion projects and the first contributions from power generation flow through.
Guidance and the growth cadence. For fiscal 2026, Williams guided to adjusted EBITDA of $8.05–8.35 billion, up roughly 6% at the midpoint versus 2025, and EPS of $2.20–2.38. First-quarter 2026 results validated the trajectory: adjusted EPS of $0.73 rose 22% year over year and beat the consensus estimate of $0.65 by $0.08, while adjusted EBITDA climbed 13%. This is a company delivering high-single-digit-to-low-double-digit EBITDA growth — a materially faster pace than the low-single-digit growth midstream investors were historically accustomed to.
Balance sheet and cash flow. The one area demanding scrutiny is leverage. Williams carries a debt-to-equity ratio of 2.33, which is high in absolute terms but typical — even conservative — for a stable, fee-based pipeline operator whose cash flows are predictable enough to support meaningful debt. The critical questions are coverage and trajectory: the company’s large, contracted EBITDA base comfortably services this debt, and management has a track record of funding growth capital (like the $1.6 billion Socrates investment) while maintaining investment-grade credit metrics and still growing the dividend. Free cash flow after the dividend funds a portion of growth capex, with the balance financed by debt at attractive rates — a standard and sustainable midstream funding model so long as leverage metrics stay disciplined.
—
5. Valuation
Valuing Williams requires blending two lenses: the earnings multiple (appropriate because WMB is solidly profitable, with positive EPS of $2.28) and the enterprise-value-to-EBITDA lens (the midstream industry standard, which properly accounts for the debt-funded asset base). We will triangulate between them and lay out scenario targets.
Where the multiple sits today. At the current price of $75.45, Williams trades at a trailing P/E of 33.15 and a forward P/E of 29.77 on next year’s EPS of $2.53. (Self-check: $75.45 ÷ $2.53 = 29.8, consistent with the 29.77 figure; $75.45 ÷ $2.28 = 33.1, consistent with the 33.15 trailing figure.) On a price-to-sales basis it trades at 7.60x and price-to-book at 7.12x. There is no getting around it: these are premium multiples relative to the historical midstream range of roughly 12–18x earnings. The market is explicitly paying up for the data-center-and-LNG growth optionality that Socrates and the broader demand backdrop represent.
P/E-based fair value. Anchoring on the consensus forward EPS of $2.53 (per the authoritative data set) and applying a premium-but-defensible multiple:
– Base case: 33.5x forward EPS × $2.53 = ~$85. This roughly matches the consensus analyst target of $84.43 and implies the market sustains today’s growth premium as the earnings compound.
– Bull case: 37.5x forward EPS × $2.53 = ~$95. This aligns with the Street-high target of $90 and above, and would require the data-center power business to scale faster than expected (additional Socrates-like contracts signed).
– Bear case: 26x forward EPS × $2.53 = ~$66. This reflects a multiple de-rating toward the higher end of the traditional midstream range, likely triggered by weaker gas volumes, a stalled data-center buildout, or rising rates compressing yield-sensitive equities.
EV/EBITDA cross-check. Using FY2026 adjusted EBITDA guidance of roughly $8.2 billion (midpoint) and an enterprise value of approximately $120 billion (market cap of $92.28 billion plus net debt), Williams trades at roughly 14–15x EV/EBITDA. A move to 16x on the same EBITDA would support an equity value consistent with the ~$85 base case, corroborating the P/E-derived target from an independent angle.
Comparison to analyst consensus. The Street is firmly constructive: of 23 analysts, 17 rate WMB a Strong Buy, 2 a Moderate Buy, and only 4 a Hold, for a Strong Buy consensus. Multiple bulge-bracket firms — Goldman Sachs, Jefferies, RBC, BofA, and Morgan Stanley — have upgraded or raised targets recently, with the Street-high reaching $90. The consensus target of $84.43 implies roughly 12% upside from $75.45, before the ~2.9% dividend. We agree with the constructive stance but would emphasize discipline on entry price: because much of the good news is already in the multiple, the risk/reward is most attractive on pullbacks toward the low-$70s or below, rather than chasing near the 52-week high of $80.07.
Net assessment. Blending the methods, we set a base-case fair value of ~$85 (roughly 13% upside), a bull case of ~$95 (~26% upside), and a bear case of ~$66 (~13% downside). With a ~2.9% dividend on top, the total-return skew is favorable, though not deeply discounted — this is a “quality at a fair (not cheap) price” setup.
—
6. Risk Factors
Risk 1 — Valuation and multiple compression. The most immediate risk is embedded in the very thing that makes WMB exciting: its premium multiple. At a forward P/E near 30x — roughly double the historical midstream average — Williams is priced for continued growth execution. If the data-center power narrative cools, if gas volumes disappoint, or if broad market sentiment rotates away from yield-and-growth hybrids, the multiple could compress meaningfully even if the underlying business performs adequately. A de-rating from ~30x to ~26x forward earnings, with no change in fundamentals, would take the stock toward the mid-$60s. Investors paying up near the 52-week high are exposed to this re-rating risk with limited valuation cushion, which is precisely why entry discipline matters here.
Risk 2 — Data-center and power-generation execution risk. The growth premium rests substantially on the assumption that projects like Socrates are the first of many. But behind-the-meter power generation is a newer business for a pipeline company, and it carries execution risks that transmission does not: construction delays, turbine equipment supply constraints, cost overruns, and regulatory or community opposition to new gas plants. If the AI capex cycle slows, or if hyperscalers shift toward nuclear (SMRs) or grid-scale renewables-plus-storage faster than expected, the pipeline of future Socrates-like contracts could thin out. The base transmission business would remain intact, but the growth that justifies the premium multiple would be called into question — and that is where the stock’s downside lives.
Risk 3 — Leverage, interest rates, and regulatory exposure. Williams carries a debt-to-equity ratio of 2.33 and, like all yield-oriented, capital-intensive infrastructure names, is sensitive to interest rates. Higher-for-longer rates raise both the company’s refinancing costs and the discount rate applied to its long-duration cash flows, and they make the ~2.9% dividend less competitive versus risk-free alternatives — a double headwind for the share price. Separately, as a FERC-regulated interstate pipeline operator, Williams faces permitting risk on expansion projects and potential shifts in energy and environmental policy. A hostile regulatory turn on new gas infrastructure, pipeline safety mandates, or methane rules could raise costs, delay projects, and pressure the growth runway. None of these is likely to impair the core franchise, but each could meaningfully affect the pace of value creation.
—

7. Conclusion & Exit Plan
Williams Companies offers a rare combination: the defensive, cash-generative stability of an irreplaceable natural gas transmission network, paired with a genuine, contracted growth engine in data-center power generation that most investors still overlook. The Socrates project and its 10-year Meta supply agreement are the proof that WMB has found a way to grow faster than its history suggests, and the industry backdrop — a projected 25% rise in U.S. gas demand by 2030, a doubling of LNG exports, and data centers consuming over 10% of U.S. electricity — provides a multi-year tailwind. The Strong Buy analyst consensus and the $84.43 price target reflect this, and we broadly concur.
The one caveat is price. Because much of the good news is already reflected in a forward P/E near 30x, this is a Buy on quality, but with entry discipline — not a deep-value bargain. We assign a rating of Buy.
Entry price range. We would look to accumulate in the low-$70s and below (ideally toward $70 or lower), where the risk/reward improves and the dividend yield becomes more compelling. Chasing near the 52-week high of $80 leaves little margin of safety.
Exit conditions:
– Target achieved: Trim the position as the stock approaches the base-case target of $85; take further profits if the bull-case $95 is reached on accelerating power-generation contract wins.
– Fundamental break: Reassess and reduce if adjusted EBITDA growth decelerates below mid-single digits for two consecutive quarters, if the data-center power pipeline fails to add new Socrates-like contracts, or if leverage rises materially above current levels without a clear deleveraging path.
– Time-based: Reassess the full thesis in 12 months, or immediately upon any major shift in AI capex trends or U.S. energy policy affecting gas infrastructure.
Summary table:
Item Detail Company Williams Companies (WMB) Current Price $75.45 Target Price $85 (base case) Upside ~13% (plus ~2.9% dividend) Rating Buy Key Thesis Irreplaceable gas transmission network + contracted data-center power growth (Socrates/Meta) Main Risk Premium valuation vulnerable to multiple compression if AI-gas demand disappoints
—
Disclaimer:
This content is general investment information provided to an indefinite/unspecified audience by a quasi-investment advisory business registered under Korea’s Financial Investment Services and Capital Markets Act, and is not personalized 1:1 investment advice tailored to any individual investor. This analysis is for informational purposes only and is not a solicitation to invest. All investment decisions and their consequences rest solely with the investor. The estimates and assumptions in this report are as of the writing date (2026-07-13) and may not materialize depending on market conditions and geopolitical variables. Financial data used reflects sources such as company filings and analyst consensus, and the scenarios and price targets represent the author’s conservative assessment. All investments carry the risk of principal loss, and past performance or analytical track record does not guarantee future results. As of the writing date, the author does not hold a position in this stock. The author’s holdings and positions may change without prior notice depending on market conditions.
함께 읽으면 좋은 글
- Astera Labs Scorpio AI Fabric Switch Ramp: Why 92x Forward Earnings Demand Caution Despite 93% Revenue Growth
- J.B. Hunt Intermodal Recovery Q2 2026 Earnings Preview: Why the Highway-to-Rail Conversion Cycle Points to $323 Upside
- Axon Enterprise AI Bookings Analysis: Why 140% Growth and a Widening SaaS Moat Point to Long-Term Upside
- T-Mobile 5G Fixed Wireless Broadband Growth: Why the Raised 2030 Outlook Points to 40% Upside
- Caterpillar AI Data Center Power Backlog Analysis: What a Record $63 Billion Order Book Means for CAT Stock in 2026