
The freight recession that punished transportation stocks from 2023 through 2025 has quietly ended, and few companies are positioned to capture the recovery as cleanly as J.B. Hunt Transport Services (NASDAQ: JBHT). With the company set to report second-quarter 2026 results on July 15 and a wave of Wall Street price-target increases landing over the past two weeks — Bernstein moving from Market Perform to Outperform with a $329 target, BMO Capital lifting its target to $320, Wells Fargo to $310, and Evercore ISI to $302 — the market is beginning to price in an intermodal inflection that management has been signaling for three consecutive quarters. This is a J.B. Hunt intermodal recovery story unfolding in real time, and the Q2 2026 earnings print is the next catalyst.
At a current price of $279.96, J.B. Hunt trades near its 52-week high of $294.98, having roughly doubled from its cycle low of $130.12. That run-up is the first thing any disciplined investor should notice, and it frames the central question of this analysis: after a powerful re-rating, is there still upside, or has the market already discounted the recovery? Our answer is nuanced — the base case sits close to fair value, but the earnings momentum and structural highway-to-rail conversion thesis create a credible path to the mid-$320s, matching the most bullish sell-side targets.
Three investment points anchor the thesis. First, J.B. Hunt’s Intermodal segment — the single largest domestic intermodal network in North America — is delivering record volumes even as pricing normalizes, and the operating leverage in that business is only beginning to show. In Q1 2026, intermodal operating income jumped 21% year over year on just 3% volume growth, a ratio that reveals how much margin recovery remains latent. Second, the company’s Dedicated Contract Services segment provides a contracted, recurring-revenue ballast with roughly 96% customer retention, insulating the model from the worst of freight-cycle volatility. Third, the valuation, while optically rich at a trailing P/E above 43, compresses to a forward multiple of 29.5x on consensus next-year EPS of $9.49 — a level that becomes defensible if the intermodal cycle sustains double-digit earnings growth.
This article walks through J.B. Hunt’s business model and five operating segments, sizes the intermodal and broader U.S. freight market, dissects the company’s economic moat, analyzes the financial trajectory, builds a scenario-based valuation, catalogs the key risks, and closes with a concrete rating and exit plan ahead of the July 15 earnings event.
1. Company Overview
J.B. Hunt Transport Services, headquartered in Lowell, Arkansas, is one of the largest surface transportation and logistics companies in North America. Founded in 1961 as a trucking operation, the company pioneered the domestic intermodal model in 1989 through a landmark partnership with the Burlington Northern (now BNSF) railroad — placing truck containers on rail for the long-haul portion of a shipment and using trucks only for the first and last miles. That structural innovation remains the foundation of the business today.
The company generates revenue across five reportable segments, each serving a distinct slice of the freight market:
Segment What it does Approx. share of revenue Q1 2026 revenue Intermodal (JBI) Container freight moved via rail + drayage trucking ~49% $1.50B Dedicated Contract Services (DCS) Customer-dedicated fleets and drivers on multi-year contracts ~27% $841M Integrated Capacity Solutions (ICS) Non-asset freight brokerage matching shippers to carriers ~7% ~$270M Final Mile Services (FMS) Home/business delivery of big-and-bulky goods ~7% ~$210M Truckload (JBT) Asset-light dry-van truckload with company trailer pool ~7% $205M
Total Q1 2026 revenue was $3.06 billion, up 5% year over year. On a trailing-twelve-month basis, the company generated $12.13 billion in revenue and $622.1 million in net income, translating to a 5.13% net margin and a 7.43% operating margin — margins that reflect the asset-intensive, cost-pass-through nature of transportation but which are now expanding off cyclical lows.
Market position and customers. Intermodal is where J.B. Hunt’s scale is most decisive. The company operates the largest company-owned container fleet in the domestic intermodal industry, exceeding 120,000 units, and runs on the rail networks of BNSF in the West and Norfolk Southern in the East. Its customer base skews toward large national shippers — retailers, consumer-products manufacturers, and e-commerce companies — for whom reliability and capacity assurance matter more than the lowest spot price. In Dedicated, roughly 96% customer retention reflects deeply embedded, contract-based relationships where J.B. Hunt effectively runs a private fleet on the customer’s behalf.
Ownership and governance. J.B. Hunt is a widely held large-cap with a market capitalization of $26.40 billion and 94.3 million shares outstanding. Institutional ownership is high, typical of an S&P 500 industrial, with major index and active managers among the largest holders. The founding Hunt family retains a meaningful, though no longer controlling, economic interest, and the company has a long record of returning capital through steady dividends and consistent share repurchases that have reduced the share count over time.
2. Industry Analysis
2-1. Market Size & Growth Trajectory
To understand J.B. Hunt, you have to understand two overlapping markets: the vast U.S. road-freight market and the faster-growing intermodal niche carved out of it.
The broader U.S. road freight transport market is enormous — estimated at roughly $584 billion in 2026 and forecast to reach approximately $703 billion by 2031, a modest compound annual growth rate near 3.8% (Mordor Intelligence). This is a mature, GDP-linked market; trucking moves the overwhelming majority of domestic freight tonnage, and its growth roughly tracks industrial production and consumer demand.
The intermodal freight transportation market, by contrast, is a structurally faster-growing subset. Estimates vary by methodology, but multiple industry researchers converge on a market worth somewhere between $31 billion and $58 billion in 2026, expanding at a compound annual growth rate in the low-teens — Mordor Intelligence models 13.3% CAGR to 2031, while Grand View Research and Research and Markets model roughly 12% growth through 2030–2032. The key point is directional consistency: intermodal is taking share from over-the-road trucking, and it is doing so at a multiple of the underlying freight market’s growth rate.
Where does the industry sit in its cycle? After the deep freight recession of 2023–2025 — during which excess trucking capacity crushed spot rates and compressed intermodal margins — the market entered a recovery phase in early 2026. Intermodal volumes have been tracking roughly 10% above the five-year average, with year-over-year growth near double digits in early 2026 (C.H. Robinson freight market data). This places the industry at the transition from early recovery into acceleration — the phase where volume growth and pricing power tend to compound, and where operating leverage is most powerful for scaled operators.
2-2. Structural Growth Drivers
Three durable drivers underpin the intermodal growth thesis, and each matters over a different time horizon.
Driver 1: Truckload cost economics and the fuel differential. The single most important structural tailwind is the cost gap between moving a container by rail versus by truck over long distances. A double-stacked intermodal train is dramatically more fuel-efficient per container-mile than an over-the-road truck, and that advantage widens when diesel prices rise. As truckload rates recover from recession lows and driver-related costs climb, the economic case for converting freight from highway to rail strengthens on hundreds of lanes. This is a near-to-medium-term driver: it responds directly to the freight cycle and can inflect quickly as truckload capacity tightens. J.B. Hunt has explicitly cited “mode conversion” as the engine behind its record intermodal volumes, particularly in its eastern network.
Driver 2: The regulatory and labor squeeze on trucking. Over a longer horizon, the trucking industry faces persistent structural cost pressure from driver availability, hours-of-service regulation, and tightening enforcement standards. A single intermodal move replaces a long-haul driver with a rail movement plus two short drayage trips, materially reducing the driver-hours required per load. As regulations grow stricter and the qualified driver pool remains constrained, the labor-efficiency advantage of intermodal compounds. This is a multi-year, structural driver that is largely independent of the freight cycle — it makes intermodal more attractive in every market environment.
Driver 3: Sustainability mandates and network investment. Large shippers increasingly carry corporate carbon-reduction commitments, and rail’s lower emissions per ton-mile make intermodal a straightforward lever for reducing Scope 3 freight emissions. Simultaneously, J.B. Hunt and its rail partners have invested in network capacity, container fleets, and terminal throughput — particularly in the faster-growing eastern network — to convert latent demand into shippable volume. This is a slow-building but persistent driver: as ESG reporting matures and network capacity expands, the ceiling on intermodal penetration rises.
Taken together, these drivers explain why intermodal grows several points faster than the freight market as a whole. The short-term dynamic is cyclical volume-and-pricing recovery; the long-term dynamic is secular share gain from trucking.
2-3. Competitive Landscape
The domestic intermodal and dedicated-fleet markets are concentrated among a handful of scaled operators. J.B. Hunt competes with the intermodal marketing companies affiliated with the railroads, with asset-based truckload carriers moving into dedicated services, and with logistics providers on the brokerage side.
Company (Ticker) TTM Revenue (approx.) Operating margin (approx.) Positioning J.B. Hunt (JBHT) $12.1B 7.4% #1 domestic intermodal; broad multi-modal platform Old Dominion (ODFL) ~$5.8B high-20s% LTL specialist; premium service, different niche Knight-Swift (KNX) ~$7.5B mid-single-digit% Largest truckload; growing intermodal/LTL Schneider National (SNDR) ~$5.5B low-single-digit% Truckload + intermodal challenger Hub Group (HUBG) ~$4.0B low-single-digit% Asset-light intermodal marketing company
Two structural advantages differentiate J.B. Hunt from this peer set. First, its intermodal scale — the largest company-owned container fleet and the deepest relationships with the Class I railroads — gives it superior capacity assurance and service reliability, the attributes large shippers value most. Second, its diversified five-segment model smooths the cyclicality of any single mode: when spot truckload is weak, contracted Dedicated revenue holds; when intermodal pricing normalizes, volume conversion offsets it. Peers that are pure-play truckload (more cyclical) or pure-play asset-light brokers (thinner moats) lack this balance. The trade-off is that J.B. Hunt’s blended operating margin (7.4%) sits below a service-premium specialist like Old Dominion, reflecting intermodal’s inherently lower-margin, higher-throughput economics — but J.B. Hunt’s margin is expanding off a cyclical trough, whereas the highest-margin peers are closer to peak. (Peer revenue and margin figures are approximate and drawn from recent reported results.)
3. Economic Moat Analysis
J.B. Hunt’s competitive advantage rests on two reinforcing pillars: efficient scale in intermodal and switching costs in dedicated contracts.
Moat Type 1: Efficient Scale in Intermodal
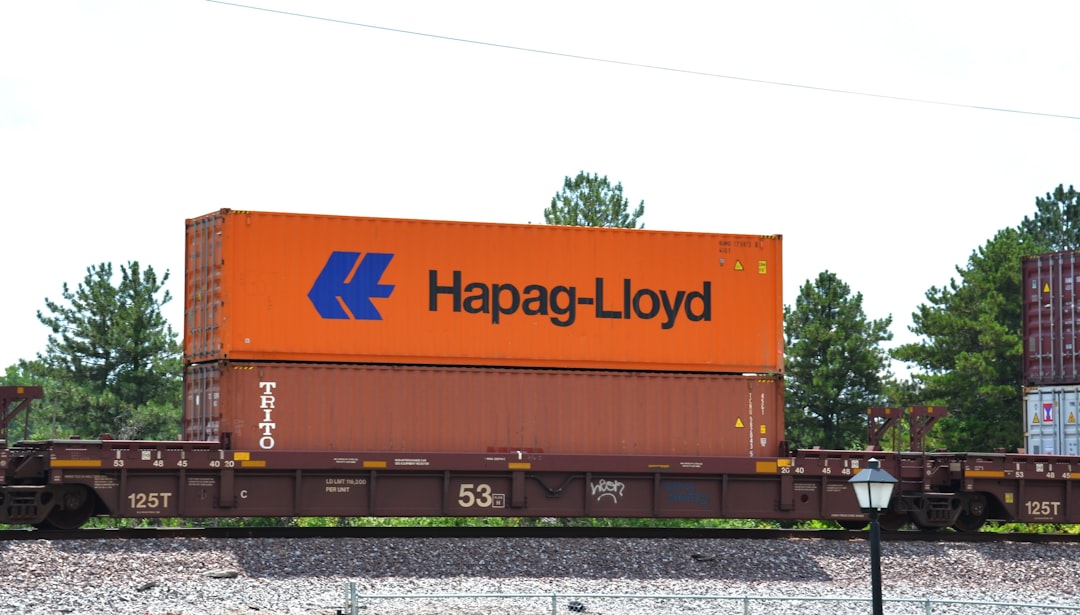
Intermodal is a business where scale is largely self-reinforcing and difficult to replicate. J.B. Hunt operates the largest company-owned domestic container fleet — more than 120,000 units — and has cultivated multi-decade operating relationships with BNSF and Norfolk Southern that give it priority access to rail capacity, dedicated train slots, and terminal throughput. A new entrant cannot simply buy its way to parity: it would need to fund an enormous container fleet, secure equivalent rail commitments (which the railroads have limited incentive to grant a subscale competitor), and build the density of drayage and terminal operations required to offer reliable nationwide service.
The concrete evidence of this moat is in the numbers. In Q1 2026, J.B. Hunt delivered the highest first-quarter intermodal volume in company history and set a record volume week in March, all while intermodal operating income rose 21% year over year. The eastern network — where the company has invested to expand capacity — grew loads 7%. Critically, this was achieved on only 3% total volume growth, which means the earnings gain came predominantly from pricing, mix, and cost efficiency rather than raw volume — a signature of pricing power and operating leverage that only a scaled network can produce. When a business grows profits seven times faster than volume, it is monetizing scale, not chasing it.
Moat Type 2: Switching Costs in Dedicated Contract Services
The Dedicated Contract Services segment is built on multi-year contracts under which J.B. Hunt designs, staffs, and operates a fleet exclusively for a single customer — effectively becoming that customer’s outsourced private fleet. These arrangements are deeply embedded in the customer’s operations: J.B. Hunt’s drivers, equipment, routing, and technology become integral to the customer’s supply chain, and unwinding the relationship would require the customer to rebuild an entire logistics function or re-tender it to a competitor at real operational risk.
The evidence of these switching costs is a customer retention rate of approximately 96% — a figure that is extraordinary in a commoditized-seeming industry and that translates directly into revenue durability. In Q1 2026, Dedicated posted $841 million of revenue and $87.4 million of operating income with productivity per truck per week up 2%. This is the segment that keeps the overall model from behaving like a pure freight-cycle bet: contracted, recurring, and sticky. It also provides a cross-selling on-ramp — dedicated customers frequently expand into intermodal and final-mile services over time.
Moat Durability Assessment
Will these advantages hold over the next five to ten years? The efficient-scale moat in intermodal is durable but not unconditional. Its most important dependency is the health and pricing behavior of the Class I railroads: if a rail partner raises pricing aggressively or under-invests in service, intermodal’s cost advantage over trucking narrows and J.B. Hunt’s value proposition weakens. The company mitigates this through long-standing relationships and by operating across two major railroads, but it does not control the rail cost curve — this is the single most important structural risk to the moat. A second risk is a sustained collapse in truckload rates (as occurred in 2023–2025), which temporarily erodes the highway-to-rail conversion economics.
The switching-cost moat in Dedicated is more self-determined and arguably more durable, because it depends on execution and relationship depth that J.B. Hunt directly controls, and 96% retention suggests the flywheel is intact. On balance, we judge the combined moat as wide and durable, with the primary vulnerability being J.B. Hunt’s dependence on rail partners it does not own — a dependency that is structural, well-understood, and, historically, well-managed.
4. Financial Analysis
J.B. Hunt’s financials tell the story of a business emerging from a freight downcycle with accelerating earnings and a conservatively financed balance sheet.
Revenue and earnings trajectory. The table below frames the recent trend, combining reported figures with the trailing-twelve-month position:
Metric Value TTM Revenue $12.13B TTM Net income $622.1M Net margin 5.13% Operating margin 7.43% Gross margin 10.55% EPS (ttm) $6.46 EPS growth (this year, est.) +21.8% Q/Q sales growth +4.6% Q/Q EPS growth +26.9%
The most important number here is the divergence between revenue growth (mid-single digits) and earnings growth (mid-20s%). That gap is operating leverage — as the freight cycle recovers, incremental revenue is dropping to the bottom line at a high rate because the network’s fixed costs are already in place. In Q1 2026 this dynamic was vivid: revenue rose 5% to $3.06 billion while operating income rose 16% to $207.0 million and diluted EPS jumped 27% to $1.49 from $1.17.
Segment-level operating metrics. The business-specific KPIs reinforce the recovery narrative:
– Intermodal: record Q1 volume, operating income +21%, eastern network loads +7% — pricing and mix driving margin recovery.
– Dedicated: ~96% customer retention, productivity per truck +2% — recurring-revenue stability.
– Truckload: revenue +23% to $205 million on +19% load volume and +3% revenue per load, with trailer turns up 15% — early evidence of tightening truckload capacity, itself a leading indicator for intermodal conversion.
Balance sheet and cash flow. J.B. Hunt is conservatively financed, with a debt-to-equity ratio of just 0.36 — low for an asset-intensive transportation company and a meaningful buffer against cyclical downturns. Return on equity of 16.7% and return on assets of 7.7% reflect a business earning solid returns on a large capital base. The low leverage gives management flexibility to continue investing in container fleet and terminal capacity through the cycle while sustaining its dividend and share-repurchase program, which has steadily reduced the share count over time.
Margin expansion story. J.B. Hunt is already profitable, so the relevant question is not path-to-profitability but path-to-margin-recovery. Operating margin at 7.4% sits well below the levels the company achieved at prior-cycle peaks, which means there is a visible runway for margin expansion as intermodal pricing normalizes and network density improves. If the intermodal recovery sustains and truckload capacity continues to tighten, the combination of volume growth and margin recovery could drive EPS from a trailing $6.46 toward the consensus next-year figure of $9.49 — a roughly 47% increase that captures both cyclical recovery and structural leverage.
5. Valuation
At $279.96, J.B. Hunt is not a statistically cheap stock, and any honest valuation has to start there. The trailing P/E of 43.3x (on TTM EPS of $6.46) is elevated — but trailing earnings are depressed by the tail of the freight recession, which makes the trailing multiple misleading. The more relevant lens is the forward multiple: on consensus next-year EPS of $9.49, the stock trades at a forward P/E of 29.5x. That is the number to anchor on, because it prices the earnings recovery the whole thesis depends on. (Self-check: $279.96 ÷ $9.49 = 29.5x, consistent with the reported forward P/E; $279.96 ÷ $6.46 = 43.3x on trailing EPS.)
Methodology. Because J.B. Hunt is profitable with a clear forward earnings estimate, a forward P/E framework is the cleanest valuation approach, cross-checked against the sell-side target range. We apply a range of forward multiples to the consensus next-year EPS of $9.49:
Scenario Forward P/E applied Implied price Upside/downside vs $279.96 Bear 24x $228 −18.6% Base 31x $294 +5.0% Bull 34x $323 +15.4%
Base case ($294, +5%). A 31x forward multiple assumes the intermodal recovery proceeds roughly on the current trajectory — sustained double-digit earnings growth, gradual margin recovery, and a premium multiple justified by J.B. Hunt’s scale and earnings momentum. This lands modestly above the current price and essentially in line with the broad analyst consensus target of $279.33, which reflects the reality that the stock has already re-rated substantially off its lows. In the base case, J.B. Hunt is a quality compounder trading near fair value, not a deep-value bargain.
Bull case ($323, +15%). A 34x multiple applies if the highway-to-rail conversion accelerates — truckload capacity tightens faster than expected, intermodal pricing power returns more forcefully, and the Q2/Q3 2026 prints beat. This scenario aligns with the most bullish recent Street targets: Bernstein at $329, BMO at $320, Wells Fargo at $310, and Evercore ISI at $302. In other words, the bull case is not a fantasy — it is what the incremental upgraders are underwriting.
Bear case ($228, −19%). A 24x multiple reflects multiple compression in a scenario where the freight recovery stalls, truckload rates roll back over, and intermodal volume growth decelerates. Given transportation’s cyclicality, this downside is real and must be respected, particularly with the stock near its 52-week high.
Reconciliation with consensus. The broad analyst consensus target of $279.33 is essentially flat versus the current price — a signal that, on average, the sell side sees J.B. Hunt as fairly valued after its run. But the distribution is skewed upward by the most recent revisions, with several firms in the $302–$329 range. We side with the view that the earnings inflection justifies a modest premium and continued ownership, while acknowledging that the base-case upside is limited enough that entry discipline matters. The asymmetry here is not screamingly favorable at $280; it improves markedly on any pullback toward the mid-$250s.
6. Risk Factors
Risk 1: Freight-cycle reversal and truckload rate weakness. J.B. Hunt is fundamentally a cyclical transportation company, and the entire recovery thesis depends on the freight cycle continuing to turn up. If the U.S. economy slows, industrial production softens, or excess truckload capacity re-emerges, spot truckload rates could roll back over — exactly what happened during the punishing 2023–2025 downturn. That would simultaneously compress the highway-to-rail conversion economics (narrowing intermodal’s cost advantage), pressure the Truckload and brokerage segments, and undermine the operating-leverage story that justifies the current multiple. With the stock near its 52-week high on recovery expectations, a cyclical disappointment would likely trigger meaningful multiple compression toward the bear-case range. This is the dominant risk, and it is largely outside management’s control.
Risk 2: Dependence on Class I railroads. J.B. Hunt does not own the rails its intermodal containers ride on — it depends on BNSF in the West and Norfolk Southern in the East. This creates two vulnerabilities. First, rail pricing: if a partner railroad raises its rates aggressively to capture more of the intermodal profit pool, J.B. Hunt’s cost advantage over trucking narrows and its margins compress. Second, rail service quality: rail congestion, labor disruptions, or service deterioration directly degrade J.B. Hunt’s on-time performance and value proposition, since the company cannot control the long-haul leg. The relationships are long-standing and generally well-managed, but the structural dependence means a portion of J.B. Hunt’s economics is determined by counterparties it does not control.
Risk 3: Valuation and elevated expectations. After roughly doubling from its cycle low, J.B. Hunt trades at 29.5x forward earnings near a 52-week high, with a broad analyst consensus target essentially flat to the current price. This leaves little margin for execution error. A single disappointing quarter — softer intermodal pricing, a margin miss, or cautious forward guidance on the July 15 call — could prompt a sharp de-rating, because the current price already embeds a fairly optimistic recovery path. High-quality businesses can absolutely justify premium multiples, but premium multiples also amplify the downside when growth disappoints. Investors buying at $280 are paying up for a recovery that is well underway and increasingly well-known.

7. Conclusion & Exit Plan
J.B. Hunt Transport Services is a high-quality, wide-moat transportation franchise catching a genuine intermodal recovery, with a July 15 earnings catalyst and a wave of Street upgrades validating the thesis. The operating leverage is real — 21% intermodal operating-income growth on 3% volume, and 27% EPS growth on 5% revenue in Q1 2026 — and the structural highway-to-rail conversion story provides a multi-year secular tailwind on top of the cyclical recovery. The balance sheet is conservative (0.36 debt-to-equity), returns are solid (16.7% ROE), and the Dedicated segment’s ~96% retention gives the model a recurring-revenue ballast that most transportation peers lack.
The tension is valuation. At $279.96, near a 52-week high and at 29.5x forward earnings, much of the recovery is already priced in. The base case points to roughly 5% upside, the bull case to about 15% (matching the highest Street targets), and the bear case to nearly 19% downside if the cycle disappoints. That is a balanced-to-slightly-favorable risk/reward that rewards patience and entry discipline rather than chasing.
Investment rating: Buy (accumulate on weakness). We rate J.B. Hunt a Buy for its quality, moat, and earnings momentum, but with explicit entry discipline given the run-up.
Entry price range. We would build a position most aggressively on pullbacks toward the $250–$260 range, where the forward multiple compresses toward the high-20s and the risk/reward improves materially. At the current $280, a partial or starter position is reasonable for long-term holders, with capacity to add on weakness.
Exit conditions:
– Target achieved: trim into strength approaching the base-case $294; take further profit near the bull-case $323 if intermodal acceleration and earnings beats drive the stock there.
– Fundamental break: reduce the position if intermodal operating income turns to year-over-year declines for two consecutive quarters, or if truckload spot rates roll over decisively — either would signal the recovery thesis is breaking.
– Time-based: reassess after the July 15 Q2 2026 print and again at year-end 2026 to confirm the margin-recovery trajectory is intact.
Item Detail Company J.B. Hunt Transport Services (JBHT) Current Price $279.96 Target Price $294 (base) / $323 (bull) Upside +5% base / +15% bull Rating Buy (accumulate on weakness) Key Thesis Intermodal recovery + highway-to-rail conversion driving operating leverage Main Risk Freight-cycle reversal amid elevated valuation near 52-week high
—
Disclaimer:
This content is general investment information provided to an indefinite/unspecified audience by a quasi-investment advisory business registered under Korea’s Financial Investment Services and Capital Markets Act, and is not personalized 1:1 investment advice tailored to any individual investor. This analysis is for informational purposes only and is not a solicitation to invest. All investment decisions and their consequences rest solely with the investor. The estimates and assumptions in this report are as of the writing date (2026-07-11) and may not materialize depending on market conditions and geopolitical variables. Financial data used reflects sources such as company filings and analyst consensus, and the scenarios and price targets represent the author’s conservative assessment. All investments carry the risk of principal loss, and past performance or analytical track record does not guarantee future results. As of the writing date, the author does not hold a position in this stock. The author’s holdings and positions may change without prior notice depending on market conditions.
함께 읽으면 좋은 글
- Axon Enterprise AI Bookings Analysis: Why 140% Growth and a Widening SaaS Moat Point to Long-Term Upside
- T-Mobile 5G Fixed Wireless Broadband Growth: Why the Raised 2030 Outlook Points to 40% Upside
- Caterpillar AI Data Center Power Backlog Analysis: What a Record $63 Billion Order Book Means for CAT Stock in 2026
- CME Group Record 30.6M Contract Volume and 24/7 Crypto Launch: Why the Derivatives Moat Points to a $285 Target
- Birkenstock (BIRK) 34% APAC Growth Story: Why the FX-and-Tariff Margin Dip Is a Buying Opportunity Toward $60