
Introduction
GE Aerospace (NYSE: GE) closed at $342.26 on June 15, 2026, sitting roughly 1.8% below the consensus 12-month price target of $348.52 and just a half percent away from its 52-week high of $348.48. To a quick-glance reader, that math says the stock has run its course. But the bigger story is that the majority of sell-side analysts rate GE a Buy or Strong Buy — Kiplinger reports a Strong Buy consensus with 16 of 22 covering analysts at Strong Buy — and at least three banks (Morgan Stanley at $425, Bernstein at $405, Citigroup at $353) have published targets that imply the consensus is conservative. The reason is not a single quarterly beat. It is a structural setup that takes years to play out and is only now hitting its acceleration phase: a $210 billion backlog reported in Q1 2026, a services book that grew nearly 40% year over year in the same quarter, and an installed base of LEAP engines that is expected to roughly triple between 2024 and 2030.
The case for opening a position here, even at 40x forward earnings, rests on three pillars that this article will work through methodically. The first is that GE Aerospace is not really an engine manufacturer; it is a high-margin services business that happens to make engines. A disproportionate share of profit comes from MRO (maintenance, repair, overhaul), spare parts, and time-and-materials contracts — a stream that compounds every year as the in-service fleet grows. The second is that the LEAP engine, which powers the Airbus A320neo family and Boeing 737 MAX through the CFM International joint venture with France’s Safran, is entering the most lucrative phase of its lifecycle right now. New engines are sold thin (in some cases at a negative gross margin once development is amortized) to lock in fleets that then generate decades of service revenue at services gross margins that frequently exceed 60–70%. The third is that even after a continued grind higher through the first half of 2026, GE’s valuation is not as stretched as the headline P/E suggests once you adjust for the services mix shift and the 2028 free cash flow guidance of $8.5 billion.
This article walks through GE Aerospace’s business model and segment economics, dimensions the commercial aviation cycle and what makes this one different from prior cycles, examines the moat that the CFM joint venture has built around narrow-body propulsion, lays out the multi-year financial trajectory implied by management’s 2026–2028 framework, and arrives at a fair-value range with explicit bull, base, and bear scenarios. It closes with a candid set of risks — Middle East geopolitics, a richly priced stock, and the eventual recovery of Pratt & Whitney — and an entry plan built around dollar-cost averaging rather than a single-point bet. Readers who want a one-line answer can take this: at $342, GE Aerospace is a high-quality, expensive compounder; the upside is meaningful only if you can hold through inevitable cyclical drawdowns and let the services flywheel do the work. For investors with a 3+ year horizon, our base-case fair value sits at $344 (essentially in line with today’s price) and our bull case reaches $430, both supported by EPS next Y of $8.60 and a forward P/E framework anchored to the services mix.
1. Company Overview
GE Aerospace, headquartered in Cincinnati, Ohio, is what remains of the storied conglomerate General Electric after the 2024 split into three independents — GE Aerospace, GE Vernova (power), and GE HealthCare (medical). The split was the culmination of nearly a decade of restructuring under former CEO Larry Culp, who continues as Chairman and CEO of the aerospace company. What investors get today is a focused commercial and defense propulsion business with a market capitalization of approximately $357 billion and trailing twelve-month revenue of $48.31 billion.
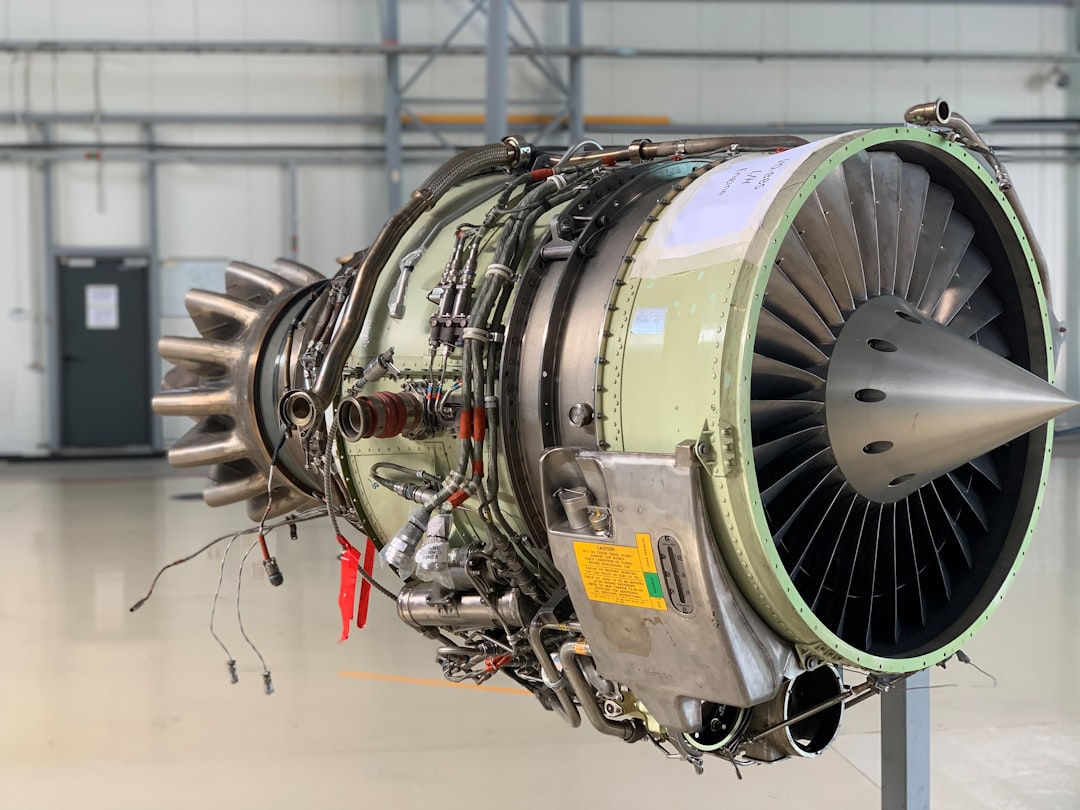
The business operates through two reporting segments. The first and dominant segment is Commercial Engines & Services (CES), which in Q1 2026 generated $8.9 billion of revenue — about 77% of the company total for the quarter. CES designs, manufactures, and services jet engines for narrow-body and wide-body commercial aircraft. The flagship products are the CFM56 (the workhorse engine on the prior generation Boeing 737 NG and Airbus A320ceo fleets), the LEAP-1A and LEAP-1B (powering today’s Airbus A320neo family and Boeing 737 MAX through the CFM International 50/50 joint venture with Safran of France), the GE90 and GEnx (powering Boeing 777 and 787 wide-bodies), and the GE9X (the engine for the new Boeing 777X). The second segment is Defense & Propulsion Technologies (DPT), which generated $3.2 billion in Q1 2026 (around 23% of revenue) and supplies engines for U.S. military fighters (F-414 for the F/A-18 Super Hornet, F-110 for the F-16), transport aircraft, helicopters, and emerging hypersonic propulsion programs.
Segment Q1 2026 Revenue YoY Growth Share of Q1 Revenue Commercial Engines & Services (CES) $8.9B +34% ~77% Defense & Propulsion Technologies (DPT) $3.2B +19% ~23% Total $11.6B +29% 100%
The customer roster spans virtually every major commercial airline (American, Delta, United, Lufthansa, IAG, Emirates, Air China, IndiGo, Ryanair), every Western airframer (Boeing, Airbus, Embraer, Bombardier), and the United States Department of Defense plus more than 30 allied militaries. The CFM International joint venture with Safran is the single most important commercial relationship — CFM has delivered tens of thousands of engines over its five-decade history, and the LEAP engine line is one of the highest-volume jet engine programs in production globally. Together with Pratt & Whitney’s GTF program and (to a much smaller extent in narrow-body) Rolls-Royce, CFM forms a tight commercial-engine oligopoly.
Ownership and governance reflect a transition from the old GE conglomerate to a focused aerospace operator. Institutional holders own the majority of shares outstanding, with Vanguard, BlackRock, and State Street holding the largest passive positions. Insider ownership is modest at under 1% — typical for a former conglomerate — but Culp has been a visible buyer of shares since the spin, a signal investors have generally taken positively. The board includes aerospace and industrial veterans, and the company has reinstated a modest dividend (current yield well under 1%) while prioritizing buybacks and reinvestment in capacity.
2. Industry Analysis
2-1. Market Size & Growth Trajectory
Global commercial aviation is a roughly $900 billion annual industry by revenue (passenger and cargo combined). The propulsion and aftermarket services sub-segment that GE Aerospace addresses is on the order of $180 billion per year. The relevant total addressable market for the company’s commercial business has two main components: new engine deliveries (multi-tens of billions of annual industry-wide value) and engine MRO and aftermarket services (~$40 billion in 2026, projected to grow toward ~$55 billion by 2030 in multiple sell-side analyses). The defense propulsion market adds another $25–30 billion globally, of which GE addresses approximately $5 billion through DPT.
The commercial aviation cycle sits in an unusual position in 2026: demand is fully recovered from the COVID dislocation, but supply is still constrained. Global revenue passenger kilometers (RPKs) surpassed 2019 levels in 2024 and are running well above that baseline today. International capacity is finally back to pre-pandemic levels, with intra-Asia traffic the strongest growth corridor. On the supply side, however, Boeing’s 737 MAX production is still below the 50/month rate the company targets, Airbus has had to push back its 75/month A320 ramp by more than a year, and Pratt & Whitney’s GTF powder-metal recall has taken hundreds of A320neo engines out of service for inspection. The combined effect is that the existing in-service fleet is being flown harder and longer, which directly drives shop visits — the highest-margin event in the engine lifecycle.
CFM/GE has guided to delivering approximately 2,000 LEAP engines in 2026, a high-water mark for the program and roughly 15–20% above 2025 deliveries. Equally important, the installed base of LEAP engines (those already on wings and generating services revenue) is projected to roughly triple between 2024 and 2030 as the prior decade of deliveries enters its first heavy shop-visit cycle. LEAP shop visit volume rose 27% in 2025 and is guided to continue at double-digit growth through 2027.
2-2. Structural Growth Drivers
There are three structural drivers behind the multi-year setup, and each is independently meaningful enough to justify a high-quality industrial multiple even before stacking them.
The first driver is the engine services compounding flywheel. Commercial jet engines are sold under the so-called “razor and blade” model: the original equipment is priced thin (in some cases at a negative gross margin once development is amortized), and the manufacturer recoups its investment over 25–35 years of aftermarket services revenue. Shop visits — when an engine is removed from a wing and brought into a CFM-authorized facility for hot-section inspection, full performance restoration, or life-limited part replacement — generate the highest margins in the entire aerospace value chain, with services gross margins frequently exceeding 60–70%. As the LEAP installed base grows, the share of CES revenue coming from services rises mechanically, dragging segment margins higher every year. This is the closest thing in industrials to a SaaS-like compounding revenue stream, and it is the single biggest reason the stock can defensibly trade at 40x forward earnings.
The second driver is air traffic growth in emerging markets. While North American and European travel growth runs at low single digits, intra-Asia traffic is compounding at high single digits, and the Indian aviation market alone — led by IndiGo’s large multi-hundred-aircraft CFM LEAP-1A commitments (310 A320neo-family aircraft most recently selected for LEAP-1A) and Air India’s fleet renewal — represents a multi-decade demand source for narrow-body engines. American Airlines added a 300+ engine LEAP-1A commitment in Q1 2026, demonstrating that even mature carriers are continuing to expand their CFM-powered fleets. The global narrow-body fleet is expected to grow from roughly 19,000 aircraft in 2024 to over 31,000 by 2040 in industry forecasts.
The third driver is the durably constrained supply environment. Composite aircraft structures, semiconductor parts for FADEC (full authority digital engine control), titanium forgings, and specialty alloys are all in tight supply, and qualification cycles for new suppliers in aerospace can run three to five years. This means even if global airline demand were to weaken in a recession, the supply backlog at GE Aerospace would continue to absorb production for years — orders booked today are not deliverable until the late 2020s. The $210 billion total backlog and $140+ billion services backlog reported in Q1 2026 represent multi-year revenue visibility that few other industrials can match.
2-3. Competitive Landscape
The commercial engine market is structurally a three-player landscape, but the dynamics vary sharply by aircraft segment. In narrow-body propulsion (single-aisle aircraft like the A320 family and 737 MAX, by far the largest segment by units), the choice is between CFM International’s LEAP and Pratt & Whitney’s PW1100G (GTF). On the Airbus A320neo, both engines are options; on the Boeing 737 MAX, the LEAP-1B is the sole engine choice. In wide-body propulsion, the GE90/GEnx/GE9X dominates Boeing’s twin-aisle platforms, while Rolls-Royce’s Trent series powers most of Airbus’s wide-body lineup. In regional jet engines, GE’s CF34 holds a particularly strong position on Bombardier and Embraer regional jets.
Company Approx. Market Cap TTM Revenue Operating Margin Key Position GE Aerospace (GE) $357B $48.3B ~18% Narrow-body co-leader (CFM JV), wide-body strong on Boeing RTX Corp (RTX) ~$200B ~$84B ~9% Pratt & Whitney GTF, Collins Aerospace, Raytheon defense Rolls-Royce (RR.L) ~$95B ~$22B ~14% Wide-body specialist (Airbus, 787), recovering after restructuring Safran (SAF.PA) ~$135B ~$32B ~16% 50/50 partner with GE on CFM, plus nacelles and landing gear
GE Aerospace’s positioning relative to peers is uniquely favorable for three reasons. First, the operating margin profile (~18% TTM) is materially higher than RTX’s diversified industrial mix and meaningfully above Rolls-Royce even after the latter’s turnaround. Second, the Pratt & Whitney GTF recall, while painful for Pratt and for airlines, has driven additional LEAP demand and reinforced CFM’s reliability narrative in the near term. Third, the CFM joint venture structure with Safran de-risks the program (capital, R&D, and inventory shared 50/50) without diluting GE’s brand or aftermarket take rate on the engine cores it manufactures.
3. Economic Moat Analysis
Moat Type 1: Efficient Scale and Switching Costs (the CFM Position)
GE Aerospace’s primary moat is a combination of efficient scale and near-irreversible switching costs. Designing, certifying, and ramping a new commercial jet engine takes 10–15 years and roughly $10–15 billion of cumulative R&D. The Federal Aviation Administration (FAA) and the European Union Aviation Safety Agency (EASA) jointly run certification regimes that take roughly five years from first design freeze. No new entrant has successfully launched a clean-sheet narrow-body commercial engine in more than four decades; the only serious attempt — China’s CJ-1000A — has been in development since the late 2000s and is still years away from full Western certification.
Once an engine is selected by an airframer (Boeing or Airbus) and an airline, switching costs are enormous. Pilots are type-rated, mechanics are trained to engine-specific tooling, parts inventory is engine-specific, and MRO contracts run 10–20 years. Airlines that operate mixed fleets (CFM and Pratt-powered A320neos, for example) report meaningfully higher maintenance costs and lower aircraft utilization than fleets standardized on a single engine type. This dynamic gives the incumbent durable pricing power on both new sales and aftermarket services.
The concrete evidence shows up in pricing. CFM/GE has secured mid-to-high single-digit annual price escalators on service contracts, with Gabelli Funds analysts projecting at least double-digit engine service price hikes on 2026 contract renewals. Spare parts revenue grew over 25% in Q1 2026, with a meaningful portion of that growth coming from price rather than pure volume. This is moat strength expressing itself directly in the P&L.
Moat Type 2: Brand and Reliability (the Aviation Safety Premium)
The second moat layer is brand-as-safety. Commercial aviation is one of the few industries in which buyers (airlines) will systematically pay a premium for incumbency because the cost of a reliability failure is catastrophic — both literally, in safety terms, and commercially, in fleet grounding terms. The Pratt & Whitney GTF powder-metal recall has cost RTX a multi-billion dollar customer-compensation bill and grounded hundreds of A320neos for inspection. Boeing’s MAX grounding cost the company over $20 billion in cumulative direct expense. GE Aerospace, by contrast, has run the LEAP fleet through tens of millions of flight hours without a comparable reliability event.
This reliability brand allows CFM/GE to win exclusive engine positions on new airframer programs (LEAP-1B is the sole engine option on the 737 MAX; GE9X is the engine on the 777X) and to command premium pricing on the time-and-materials portion of service contracts. When IndiGo, Air India, or American Airlines weighs the LEAP versus the GTF on a new A320neo order, the GTF recall episode is now part of the implicit risk calculus, and it tilts decisions toward CFM at the margin.
Moat Durability Assessment
The critical question is whether these moats hold for 5, 10, or 20 years. Three threats deserve serious consideration. First, sustainable aviation fuel (SAF) and hydrogen propulsion could eventually disrupt the kerosene-burning turbofan paradigm. Best-case timelines suggest hydrogen narrow-bodies are a 2040+ proposition; GE Aerospace is meaningfully invested in the CFM RISE open-fan demonstrator program that targets a clean-sheet engine for the early 2030s, and the technical lead time means incumbents are likely to capture the next propulsion paradigm too. Second, the Chinese CJ-1000A is the most serious potential new entrant, but it faces a multi-decade certification, supply chain, and trust gap. Even if China successfully fields a domestic narrow-body engine for the COMAC C919, Western airlines are unlikely to adopt it in the near term. Third, geopolitical fragmentation — particularly U.S.-China decoupling on aerospace technology — could limit GE’s addressable market in China, but the math shows China represents a contained portion of GE’s installed base today, so the impact is bounded.
Net of these threats, the moat is structurally intact through at least the 2030s. The risk of a credible new entrant winning meaningful share in narrow-body propulsion within 10 years is very low; the risk of paradigm-shift technology disrupting the current installed base within 15 years is also low. The services flywheel — once an engine is on a wing, it generates roughly 25 years of cash — provides a particularly long runway because even a hypothetical 2032 product disruption would not impair the cash flow from engines delivered in 2018–2028.

4. Financial Analysis
Revenue and Profit Trajectory (TTM and Forward)
The trailing twelve-month figures for GE Aerospace stand at $48.31 billion of revenue (Sales) and $8.62 billion of net income (Income), implying a net margin of approximately 17.84%. Operating margin is 18.13% and gross margin is 35.87% (Finviz TTM). These figures reflect the post-split aerospace pure-play and are meaningfully higher quality than the legacy GE conglomerate margins. ROE is exceptional at 45.90% (helped by post-spin capital structure with a moderate Debt/Equity of 1.18), and ROA is 6.77%, in line with the asset-heavy nature of the engine manufacturing business. Sales growth in the most recent quarter ran +24.73% Q/Q, and EPS growth this year is tracking at +18.55%.
Metric (annual) 2023 2024 2025 TTM (Finviz) 2026E (mgmt) Revenue ~$32B ~$38B ~$45B $48.3B ~$52B (implied) Adj. EPS ~$2.55 ~$4.60 ~$6.40 $8.11 $7.10–$7.40 (guidance) Operating profit ~$5.5B ~$7.6B ~$8.7B ~$8.8B $9.85B–$10.25B (guidance) Free cash flow ~$5.2B ~$6.1B ~$6.4B ~$6.8B $8.0B–$8.4B (guidance) Total backlog ~$170B ~$175B ~$190B $210B+ (Q1’26) continued growth
A note on the apparent gap between Finviz TTM EPS ($8.11) and management’s 2026 calendar-year adjusted EPS guidance of $7.10–$7.40: the company guidance is on a calendar-year basis using management-defined adjusted EPS, while the Finviz TTM EPS captures the four most recent reported quarters (which includes a particularly strong Q1 2026 of $1.86 EPS) and uses a different normalization. Both figures are real. The Finviz consensus EPS next Y of $8.60 captures sell-side modeling of the next fiscal year, which is where the LEAP services ramp is expected to fully manifest. The valuation work below is anchored to these figures.
The Q1 2026 print was particularly notable. Revenue of $11.6 billion grew 29% year over year, operating profit of $2.5 billion grew 18%, and free cash flow of $1.7 billion grew 14%. The single most important data point in the print was that services revenue inside CES grew 39% with spare parts up over 25% — a confirmation that the LEAP services flywheel is now in its acceleration phase. Orders surged 87% to $23 billion, including the 300+ LEAP-1A commitment from American Airlines. Management held full-year guidance citing Middle East uncertainty and a potential lag effect on commercial services in the second half, but the underlying operational trajectory through Q1 ran ahead of plan.
Balance Sheet and Capital Returns
Post-spin, GE Aerospace runs a clean balance sheet with Debt/Equity of 1.18 and meaningful cash on hand. Management has prioritized capital returns alongside reinvestment in capacity. The company executed multi-billion dollar share repurchases in 2025 and has guided to continued capital return through 2026–2028. The dividend has been re-established but remains modest at well under 1% yield. The 2028 framework targets $8.5 billion of annual free cash flow (raised from $7 billion at the 2024 Investor Day), with FCF conversion exceeding 100% of net income — a hallmark of capital-light services-mix businesses.
Operating Metrics That Matter Most
For a propulsion business, the metrics worth tracking are not standard industrial KPIs but rather: shop visit volume (a leading indicator of services revenue), installed base growth (which mechanically drives future shop visits), spare parts price/volume mix, engine deliveries (a leading indicator of future installed base), and backlog book-to-bill. Q1 2026 readings across all five were either at all-time highs (backlog $210B, services revenue +39%) or running comfortably ahead of multi-year plan (LEAP deliveries pacing toward the 2,000 target, shop visits +27% in 2025 with continued double-digit growth guided).
5. Valuation
Methodology Selection
For a high-margin services-mix industrial with multi-year revenue visibility from a $210 billion backlog, the most defensible valuation approach is forward P/E anchored to the Finviz consensus EPS next Y of $8.60, supplemented by an EV/EBITDA cross-check against industrial-services peers and a free-cash-flow yield sanity check against the 2028 framework. A traditional 5-stage DCF is feasible but introduces more terminal-value assumption sensitivity than is warranted given the backlog visibility.
Forward P/E Framework
Using EPS next Y of $8.60 (Finviz consensus forward) and applying scenario multiples calibrated to the services mix and growth trajectory:
Scenario Forward P/E Fair Value vs. Current ($342.26) Bear 30x $258 -24.6% downside Base 40x $344 +0.5% (in line with price) Bull 50x $430 +25.6% upside
The base-case 40x multiple is essentially in line with the current Forward P/E of 39.78. This is deliberate: at $342, the market has fairly priced GE Aerospace for its base-case forward trajectory. Upside requires either bull-case multiple expansion (sell-side consensus revising EPS estimates upward as services mix continues to surprise) or upside to the EPS itself.
The current Forward P/E of roughly 39.8 reflects the $342.26 price against EPS next Y of $8.60, and the trailing multiple of about 42 reflects the same price against TTM EPS of $8.11 — both consistent with the Finviz-reported figures. The $344 base-case fair value corresponds to 40x EPS next Y. With EPS meaningfully positive, P/E is a valid valuation lens here.
EV/EBITDA Cross-Check
Industrial-services businesses with comparable margin and growth profiles (e.g., TransDigm, HEICO, Otis) trade at 22–28x forward EBITDA. GE Aerospace’s implied forward EBITDA for 2026 is approximately $11–12 billion (operating profit guidance midpoint plus D&A), and net debt is modest given the Debt/Equity of 1.18 and substantial cash on hand. Enterprise value at the current price is in the neighborhood of $365–375 billion, implying a forward EV/EBITDA roughly in the low-30s — slightly above the high end of the comp set. This is consistent with the forward P/E read: the stock is fully valued on near-term metrics but defensible if you believe the services mix shift continues.
Free Cash Flow Yield
At the 2028 management framework of $8.5 billion annual FCF, current market cap of $357 billion implies a 2028 FCF yield of approximately 2.4%. That is a modest absolute yield but is supported by a growth trajectory: FCF compounding from $6.4B in 2025 to $8.5B in 2028 implies roughly 10% annual FCF growth, which on a long-duration compounder profile is consistent with the multiple.
Analyst Consensus Comparison
The consensus 12-month price target of $348.52 sits just above current ($342.26) with only 1.8% upside — implying the sell-side is essentially in agreement with our base case. The dispersion is more interesting than the average: Morgan Stanley’s $425 implies the bull case is real, while more conservative houses anchor the bear-side dispersion. The aggregate Strong Buy weighting (16 of 22 analysts per Kiplinger compilations) signals high directional conviction even with limited near-term upside in the consensus number.
Scenario Conclusion
The base-case fair value is $344, almost exactly where the stock trades today. The bull case is $430 (multiple expansion to 50x as services mix continues to surprise upward). The bear case is $258 (multiple compression to 30x in a cyclical downturn or services miss). This is not a deep-value setup — it is a quality-compounder setup that requires investors to be willing to pay full price for durable competitive advantage and accept that returns over the next 12 months will be driven by execution, not by multiple re-rating.
6. Risk Factors
Risk 1: Middle East Geopolitics and Commercial Services Demand
The single most important near-term overhang flagged by management on the Q1 2026 call was Middle East conflict uncertainty and its potential lag effect on commercial services in the second half of 2026. Roughly 20% of global commercial aviation traffic flows through or around the Middle East corridor, and Gulf carriers (Emirates, Etihad, Qatar Airways, Saudia) are among the largest single buyers of CFM and GE wide-body engines. A meaningful escalation that closes airspace, raises insurance costs, or forces fleet repositioning would reduce flight hours, which directly reduces shop visits and aftermarket services revenue. The company held full-year guidance through Q1, but the next two quarterly prints will be closely watched for any softening in the services growth rate. Investors should expect at least one quarter of guidance pressure if regional tensions worsen, even though the structural backlog absorbs the impact over a multi-year window. This is the single most asymmetric near-term risk in the thesis.
Risk 2: Pratt & Whitney GTF Recovery and Competitive Re-Pricing
The Pratt & Whitney GTF powder-metal recall has been a tailwind for GE/CFM since 2024, driving incremental LEAP demand and reinforcing the reliability narrative. As Pratt completes its inspection and parts replacement program through 2026 and 2027, the competitive intensity in narrow-body propulsion could increase. Pratt has signaled it will price aggressively to win back airline confidence on next-generation aircraft orders, and the GTF Advantage variant (entering service in the latter half of the decade) targets the same fuel burn and operating cost envelope as the next generation of LEAP. If the GTF Advantage delivers as advertised and Pratt secures meaningful share on the next A320neo order wave (Indian and Asian carriers in 2026–2027), GE’s narrow-body share position on the A320neo platform could compress modestly. The impact on services would lag by 5–7 years, but the order book and multiple could de-rate sooner.
Risk 3: Valuation Compression in a Broad Market Drawdown
GE Aerospace trades at a Forward P/E of 39.78 — a premium multiple that requires a benign macro and an optimistic services trajectory to sustain. In a 15–20% S&P 500 drawdown driven by recession risk, multiple compression alone could take GE into the high $200s even if fundamentals continue to deliver. Industrial-services peers like TransDigm and HEICO saw 25–35% drawdowns during the 2022 market correction despite continuing to grow earnings. This is the most generic of the three risks but is also the most likely to be realized within a 12–18 month window, because it does not require a fundamental thesis break — it only requires a market regime change. This is why the entry plan below is built around scaled buying rather than a single-point allocation.
7. Conclusion & Exit Plan
GE Aerospace is the highest-quality way to express the commercial aviation services super-cycle thesis, and the company’s Q1 2026 print confirmed that the LEAP services flywheel has entered its acceleration phase. At $342.26, however, the stock prices in most of that good news. The base-case fair value of $344 sits essentially at the current price, the consensus 12-month target of $348.52 implies less than 2% upside, and the Forward P/E of 39.78 leaves little room for error if the services growth rate fades or if Middle East risk crystallizes.
For a long-duration compounder, that is not a reason to avoid the stock — it is a reason to size the position appropriately and to scale in through volatility rather than chasing the 52-week high. The thesis works on a 3+ year time horizon if you believe (i) the LEAP installed base will roughly triple by 2030, (ii) services mix will continue to drag operating margins higher, and (iii) the $190–210B backlog provides multi-year revenue visibility that supports a premium multiple through the cycle. The thesis breaks if Middle East geopolitics meaningfully impairs flight hours for multiple quarters, if Pratt’s GTF Advantage takes more narrow-body share than expected, or if multiples compress in a broad market drawdown.
Investment Rating: Buy (with patience and position sizing discipline)
Entry Plan: Build the position in tranches rather than a single buy. Tranche 1 at the current price ($340 area) at roughly one-third of intended allocation. Tranche 2 if shares pull back into the $310–320 range (a 7–10% drawdown). Tranche 3 if a market-wide selloff drives GE into the $275–290 zone, which would represent a Forward P/E re-rating to the low-to-mid 30s on EPS next Y of $8.60.
Exit Conditions:
– Bull-case target approached: Trim 25% of position around $400; consider full exit consideration near $430.
– Base-case held: Continue to hold through the base-case range of $330–360, reassessing annually as the 2028 framework realization comes into view.
– Thesis-break exit: Reduce by 50% if services growth decelerates below 10% YoY for two consecutive quarters AND backlog book-to-bill drops below 1.0x.
– Stop-loss / impairment trigger: Re-evaluate fundamentals if shares fall below $260 (representing roughly 30x Forward P/E and bear-case fair value).
– Time-based: Reassess full thesis in 12 months (June 2027), with particular focus on 2027 LEAP delivery cadence and shop visit trajectory.
Item Detail Company GE Aerospace (GE) Current Price $342.26 Target Price (Base) $344 Target Price (Bull) $430 Upside (Bull) +25.6% Rating Buy (scaled entry) Key Thesis LEAP services flywheel in acceleration; $210B+ backlog provides multi-year visibility Main Risk Middle East geopolitics + ~40x Forward P/E leaves little margin for error
—
Disclaimer: This article is for informational purposes only and does not constitute investment advice. All data sourced from public filings, analyst reports, and news as of the publication date (June 16, 2026). Invest at your own discretion.
함께 읽으면 좋은 글
- Salesforce Agentforce ARR Surges 205% to $1.2B: Why CRM Stock at 10x Forward Earnings Is a Generational AI Buy in 2026
- Lockheed Martin Golden Dome and PAC-3 Contract Surge: Why the $186 Billion Backlog Makes the 22% Pullback a Buy Opportunity
- Wells Fargo Asset Cap Removal: How the Fed’s 2025 Decision Unlocks a 15%+ Upside Path Through 2026
- Applied Materials AMAT Reanalysis: Why the Base Case Already Hit and a Cantor-Backed Path to $650 Resets Our Bull Thesis
- Vistra (VST) Nuclear Hyperscaler PPA Analysis: 3,800 MW of 20-Year Contracts and the Path to 68% Upside