
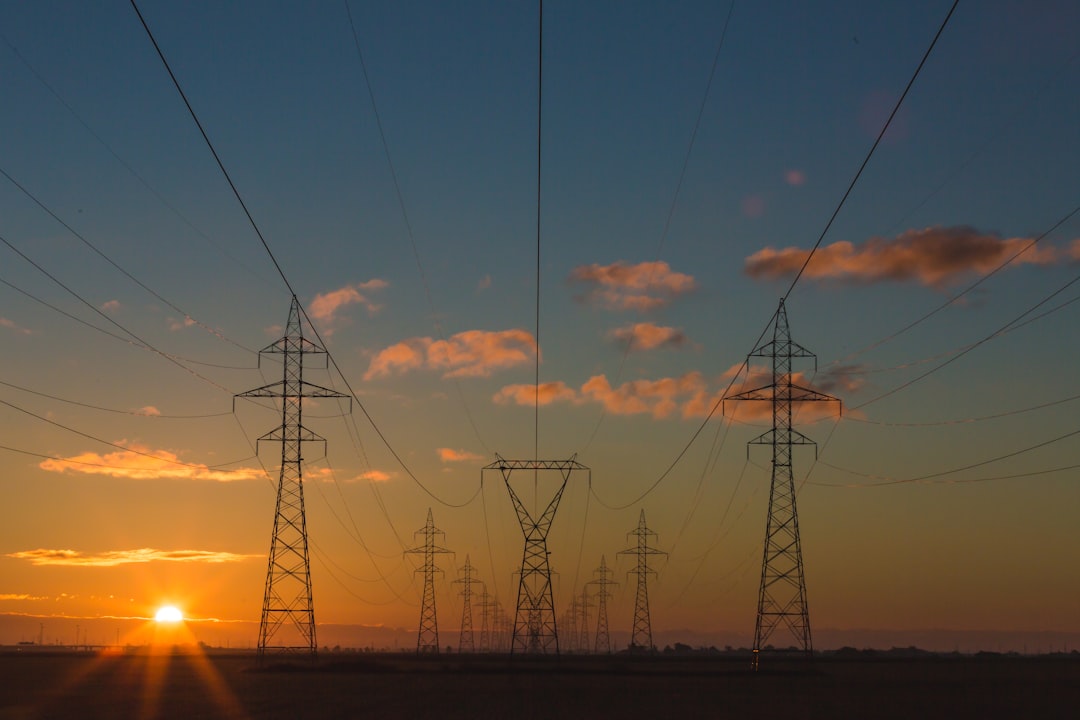
When most investors think about the artificial-intelligence boom, they picture Nvidia’s GPUs, hyperscaler cloud contracts, or the newest large language model. Far fewer stop to ask a more basic question: what actually powers the buildings full of those chips? The answer is unglamorous but enormous — switchgear, transformers, busway, uninterruptible power supplies, circuit protection, and the engineering that ties it all together. And in that world, Eaton Corporation plc (NYSE: ETN) sits at the center of one of the most durable demand cycles in the industrial economy.
On July 30, 2026, Eaton reported record second-quarter results that reframed its investment story. Revenue rose 21.4% year over year to $8.53 billion, beating consensus by more than 6%, and adjusted earnings came in at $3.15 per share. More important than the headline beat was the momentum underneath it: data-center organic revenue grew roughly 65%, far outpacing the ~23% growth of the underlying market, and management once again raised full-year guidance — lifting organic growth to 11–13% and adjusted EPS to $13.40–$13.60. Eaton now estimates the total U.S. data-center project backlog at 307 gigawatts, which it characterizes as roughly 15 years of construction at 2025 build rates, up from 12 years in its prior update.
This article makes the case that Eaton is one of the highest-quality ways to own the electrification and AI-power theme, and it does three things to support that view. First, it dissects Eaton’s business model and segment mix so you understand exactly where the money comes from. Second, it goes deep — more than a thousand words — on the industry: the electrical-equipment market, the structural growth drivers behind it, and how Eaton stacks up against Schneider Electric, Vertiv, and ABB. Third, it works through the financials and a step-by-step valuation, landing on a base-case price target of roughly $465 (about 12% above the current $415.20) with a Buy rating, while being honest about the risks that could break the thesis. The main lens throughout is Eaton’s data center electrical backlog and what it implies for earnings power over the next several years.
Three key investment points frame everything that follows. (1) The demand is structural, not a fad. AI compute, grid modernization, reshored manufacturing, and electrification of everything from vehicles to buildings all convert into the same thing — more electrical content per dollar of GDP, and Eaton sells that content. (2) The margins are inflecting. Operating margin has climbed from 14.4% in 2022 to 19.0% in 2025, and management is guiding segment margin toward the mid-24% range in 2026, evidence that pricing power and mix are real. (3) The cash generation funds a virtuous cycle — free cash flow reached $3.55 billion in 2025, financing dividends, buybacks, and bolt-on acquisitions like the Boyd Thermal deal that deepen Eaton’s data-center thermal-management reach.
—
1. Company Overview
Eaton is an intelligent power-management company. In plain terms, it designs and manufactures the equipment that distributes, controls, protects, converts, and monitors electrical power — plus hydraulic and aerospace systems that manage motion and fluid power. It is domiciled in Ireland, run operationally from Dublin and Beachwood, Ohio, and traces its roots back more than a century to a truck-axle business, a lineage that explains why it still has a Vehicle segment alongside its now-dominant electrical franchise.
How Eaton makes money. The company sells physical products (circuit breakers, switchgear, transformers, UPS systems, busway, wiring devices, aerospace fuel and hydraulic systems) supplemented by engineering, software, and aftermarket services. Revenue is recognized both on point-of-sale hardware and, increasingly, on large project-based orders for data centers, utilities, and industrial facilities that ship over multiple quarters — which is why backlog has become such an important leading indicator for the stock.
Revenue breakdown by segment. Eaton reports five segments. Based on 2025 quarterly run-rates, the approximate full-year mix looks like this:
Segment Approx. FY2025 revenue* Share of total What it sells Electrical Americas ~$13.0B ~47% Switchgear, breakers, busway, UPS, grid & data-center power (Americas) Electrical Global ~$6.3B ~23% Same electrical portfolio, EMEA + Asia-Pacific Aerospace ~$4.2B ~15% Fuel, hydraulic, motion-control, electrical systems for aircraft Vehicle ~$2.9B ~11% Transmissions, drivetrain, differentials for commercial & light vehicles eMobility ~$0.7B ~3% EV power distribution, inverters, DC-DC converters
*Segment figures are approximate, derived from disclosed quarterly run-rates; total company revenue was $27.45 billion in 2025.
The critical takeaway: the two Electrical segments together make up roughly 70% of revenue, and they are the fastest-growing, highest-margin parts of the company. Eaton is, functionally, an electrical-infrastructure business with an attractive aerospace kicker and a legacy vehicle operation that is being repositioned toward electrification.
Customers and market position. Eaton’s customers span hyperscale cloud operators, colocation data-center developers, electric utilities, industrial and commercial builders, OEM aircraft manufacturers, and distributors. In the fast-growing data-center power niche, industry research consistently groups Eaton among the top global players alongside Schneider Electric, Vertiv, and ABB — a handful of firms that collectively account for roughly 40–43% of the data-center power and UPS markets. Eaton is not a monopolist in any single product, but it is one of a small oligopoly of scaled, trusted, spec-in vendors in mission-critical power.
Ownership and governance. Eaton is a large-cap, index-heavyweight stock with a market capitalization of about $161 billion and roughly 388 million shares outstanding. Ownership is dominated by institutional investors — the usual large index and active managers — with minimal insider ownership, typical for a company of this scale and age. Management has built credibility by consistently raising guidance through 2025 and 2026 rather than resetting it lower, which matters for how the market underwrites the backlog.
—
2. Industry Analysis
This is the most important section, because Eaton’s investment case rests less on company-specific heroics than on being extraordinarily well-positioned inside a structurally growing market. Understand the industry and you understand the stock.
2-1. Market Size & Growth Trajectory
Eaton participates in the global electrical-equipment market — a multi-hundred-billion-dollar universe spanning power distribution, circuit protection, industrial controls, and critical power. Historically this was a low-growth, GDP-plus category: electrical demand tracked construction and industrial output, growing in the low-to-mid single digits. That framing is now obsolete for the segments Eaton emphasizes.
The reason is a convergence of demand vectors that all resolve into more electrical content. The single most cited driver is the AI-driven data-center buildout. Eaton’s own figure — a 307-gigawatt U.S. data-center project backlog equal to roughly 15 years of construction at 2025 build rates — captures the scale. Even if that pipeline is only partially realized, it implies a decade-plus runway of above-trend demand for the exact switchgear, busway, and UPS equipment Eaton sells. Within Eaton, data-center organic revenue grew about 65% in Q2 2026 against an underlying market growing ~23%, meaning Eaton is taking share inside a fast-growing pie.
Where is the industry in its cycle? For the electrical-infrastructure portion, the honest answer is acceleration, not maturation. The data-center power market is early-to-mid in a multi-year capacity expansion; grid modernization in the U.S. and Europe is still in its early innings; and reshoring of manufacturing is only a few years into a decade-long trend. That is a rare setup for a business this large — the addressable market is expanding faster now than it did a decade ago.
2-2. Structural Growth Drivers
Driver 1 — AI compute and the data-center power crisis. Training and serving large AI models is extraordinarily power-hungry. A single modern AI data center can draw as much electricity as a small city, and each facility requires layered electrical infrastructure: medium-voltage switchgear to take utility power, transformers to step it down, busway to distribute it, UPS systems and batteries to ride through outages, and increasingly sophisticated power and thermal management to keep GPU racks running at high density. Crucially, the electrical content per megawatt is rising as densities climb, so Eaton’s revenue grows faster than raw megawatts. This is the driver behind Eaton’s 65% data-center growth and its Boyd Thermal acquisition, which pushes the company deeper into liquid-cooling-adjacent power and thermal systems. This driver is both a near-term catalyst (orders and backlog are surging right now) and a long-term one (the 307-GW pipeline stretches out more than a decade).
Driver 2 — Grid modernization and electrification of everything. Independent of AI, the electricity grid across developed economies is aging and under-built for a world that is electrifying transport, heating, and industry. Utilities are investing heavily in transmission, distribution, and grid-hardening; renewable interconnection requires new switchgear and protection; and electrification of vehicles and buildings raises baseline electricity demand. Eaton sells directly into utility and grid applications and benefits as electricity’s share of final energy consumption rises. This is a slower-burning but extremely durable driver — measured in decades, underpinned by policy, decarbonization goals, and simple load growth. It also diversifies Eaton away from over-reliance on the data-center cycle.
Driver 3 — Reshoring, industrial capex, and megaprojects. The past several years have seen a wave of announced U.S. and European megaprojects — semiconductor fabs, battery plants, EV factories, and reshored manufacturing — each of which needs enormous electrical build-out before a single widget is produced. Eaton’s Electrical Americas segment is a prime beneficiary, and the multi-year nature of these projects converts into the visible, growing backlog that de-risks near-term revenue. Layered on top is the aerospace up-cycle: commercial aircraft build rates and defense demand are lifting Eaton’s Aerospace segment at double-digit organic rates, adding a fourth, uncorrelated leg to the growth story. Together these drivers give Eaton multiple, partially independent ways to keep compounding revenue in the double digits.
2-3. Competitive Landscape
Eaton competes against a small set of scaled global players. The comparison below is directional — exact figures vary by fiscal calendar and reporting standard — but it captures the strategic picture.
Company Approx. scale / focus Positioning vs. Eaton Eaton (ETN) ~$30B revenue TTM; electrical + aerospace + vehicle; ~19% operating margin Broadest power-management portfolio; strong Americas franchise; margin inflecting up Schneider Electric Larger revenue base; energy management & automation Global leader in energy management; strong software (EcoStruxure); more Europe/Asia weighted Vertiv (VRT) Data-center pure-play; power + cooling Higher data-center concentration = higher beta to that single cycle, more volatile ABB Electrification + robotics/automation Strong global electrification; automation exposure Eaton lacks Legrand / Delta / Cummins Niche power / backup power Point competitors in specific product categories
Why is Eaton well-positioned relative to peers? Three reasons. First, breadth with focus: Eaton offers a broad electrical portfolio (making it a one-stop spec-in vendor for a data center or utility project) while still being ~70% concentrated in the highest-growth electrical segments. Second, balance: unlike Vertiv, which is a data-center pure-play and therefore highly exposed to a single cycle, Eaton diversifies across data centers, grid/utility, industrial, aerospace, and vehicle — so a pause in any one end-market is cushioned by the others. Third, the installed base and channel: decades of shipped equipment create a large aftermarket and a distributor/electrical-contractor channel that is genuinely hard for a new entrant to replicate. That combination — broad, balanced, and entrenched — is why Eaton commands a premium multiple even among a strong peer group.
—
3. Economic Moat Analysis
Eaton’s competitive advantages are real but they are of the industrial, cumulative kind rather than the flashy platform kind. Two moat sources stand out.
Moat Type 1: Switching Costs and Specification Lock-In
Electrical infrastructure is mission-critical and long-lived. When an engineering firm designs a data center, hospital, or fab, it specifies particular switchgear and power equipment into the drawings, and that equipment then sits in the building for 20–40 years. Ripping it out to switch vendors is expensive, risky, and rarely worth it. Once Eaton is designed into a facility, it tends to win the follow-on aftermarket — spare parts, service, upgrades, and expansions — at high margins for the life of the asset. This shows up in the numbers as durable pricing power: Eaton’s operating margin expanded from 14.4% in 2022 to 19.0% in 2025 even as it grew rapidly, which is the financial fingerprint of a business that can raise prices without losing volume. In mission-critical power, customers pay for reliability and the reassurance of a trusted, spec-approved brand, not the lowest sticker price.
Moat Type 2: Efficient Scale and Installed-Base Network
The scaled electrical vendors — Eaton, Schneider, Vertiv, ABB — enjoy an efficient-scale dynamic: the market rewards a handful of players large enough to serve global customers, hold deep inventories, and maintain dense service networks, and it does not easily support a fifth or sixth entrant at the same scale. Eaton’s global manufacturing footprint, its relationships with electrical distributors and contractors, and its enormous installed base of equipment already in the field create a self-reinforcing advantage. Every unit shipped expands the aftermarket annuity and deepens the channel relationships that make Eaton the default choice on the next project. New entrants face not just capital intensity but the far harder challenge of earning decades of trust in applications where failure is unacceptable.
Moat Durability Assessment
Will these moats hold for 5–10 years? On balance, yes — with caveats. The switching-cost and installed-base advantages are structural and slow-moving; they do not evaporate in a downturn. The main risk to the moat is not a competitor out-innovating Eaton but rather technological shifts in data-center power architecture — for example, a move toward radically different DC power distribution, on-site generation, or novel cooling-power integration that could reshuffle which vendors win. Eaton is defending against this proactively (the Boyd Thermal acquisition is exactly such a hedge), and its breadth makes it more adaptable than a single-product competitor. A second risk is that the very attractiveness of the market invites aggressive capacity additions from Schneider, Vertiv, and ABB, compressing industry margins over time. The counterargument: demand is growing so fast, and the spec-in dynamics are so sticky, that all the scaled players can grow profitably for years before supply catches demand. Net assessment — a wide, durable moat, with the primary watch-item being architectural change rather than conventional competition.
—
4. Financial Analysis
Eaton’s financial trajectory is the clearest evidence that the industry tailwinds are translating into shareholder value. The table below shows the GAAP progression over four years, plus the trailing-twelve-month (TTM) figures.
Fiscal year Revenue Operating income Operating margin Net income Diluted EPS Free cash flow 2022 $20.75B $3.00B 14.4% $2.46B $6.14 $1.94B 2023 $23.20B $3.89B 16.7% $3.22B $8.02 $2.87B 2024 $24.88B $4.63B 18.6% $3.79B $9.50 $3.52B 2025 $27.45B $5.21B 19.0% $4.09B $10.45 $3.55B TTM $30.02B — ~19.4% $3.83B $9.83 —
Source: company filings; TTM Sales/Income and margins per Finviz. Note that TTM net income of $3.83B reflects acquisition-related and one-time charges in the first half of 2026, so it sits below the 2025 full-year figure even as revenue climbs.
The revenue story. Revenue grew roughly 11.8% in 2023, 7.3% in 2024, and 10.3% in 2025, then accelerated in 2026 — Q2 revenue alone rose 21.4% (with 14% organic and 7% from acquisitions). The trend is one of accelerating top-line growth, driven overwhelmingly by the electrical segments and the data-center ramp described above. Reaching a $30 billion TTM revenue run-rate marks a company that has meaningfully changed gear.
The margin story. This is arguably the most impressive part. Operating margin expanded by roughly 460 basis points in three years — from 14.4% to 19.0% — a remarkable feat for a hardware-heavy industrial. It reflects favorable mix (electrical growing faster than lower-margin vehicle), pricing power from the spec-in moat, and operating leverage on higher volumes. Management’s 2026 guidance for segment margin of 24.1–24.5% signals the expansion is continuing. Rising margins on rising revenue is the definition of high-quality growth.
Operating metrics that matter. For Eaton, the key non-GAAP indicators are orders and backlog. Backlog has been growing across the electrical segments, and the company’s framing of a 307-GW U.S. data-center pipeline gives investors unusual visibility into future revenue. Aerospace backlog is also robust on the commercial-aircraft up-cycle. When a capital-goods company’s backlog is growing faster than its revenue, near-term estimates carry lower risk — and that is Eaton’s current situation.
Balance sheet and cash flow. Eaton generated $4.47 billion of operating cash flow in 2025 and, after $919 million of capital expenditure, $3.55 billion of free cash flow — up from $1.94 billion just three years earlier, an FCF near-doubling. The company returned roughly $1.63 billion to shareholders in dividends and repurchased about $1.86 billion of stock in 2025, while still funding bolt-on M&A. Leverage is moderate: a debt-to-equity ratio around 1.05, comfortably serviced by growing cash flow, with return on equity near 19.7% and return on assets around 7.9%. This is a profitable, cash-generative, shareholder-friendly compounder — not a speculative growth story dependent on external financing.
Profitability, not a path-to-profit story. Unlike many AI-adjacent names, Eaton is deeply profitable today. The relevant question is not when it turns a profit but how much further margins can expand. With segment margins guided toward the mid-24% range and mix continuing to shift toward electrical, there is a credible multi-year margin-expansion runway on top of double-digit revenue growth.
—
5. Valuation
Because Eaton is solidly profitable, a forward P/E framework is appropriate (a discounted-cash-flow model would reach similar conclusions given the visible FCF growth). All fair-value math below is anchored to the consensus forward earnings estimate of $15.80 per share (EPS next year), consistent with Eaton’s guidance trajectory.
The starting point. At $415.20, Eaton trades at a trailing P/E of 42.3x ($415.20 ÷ $9.83 TTM EPS) and a forward P/E of 26.3x ($415.20 ÷ $15.80). The trailing multiple looks optically high, but it is distorted by the one-time charges that depressed TTM net income; the forward multiple of ~26x is the more meaningful figure and is the number to underwrite. Other multiples: price-to-book 7.96x, price-to-sales 5.37x.
Is ~26x forward earnings reasonable? For a business growing revenue in the low-double-digits with expanding margins, ~20% ROE, and a decade-plus visible backlog, a premium multiple is defensible. Historically, high-quality electrical compounders have commanded mid-20s to low-30s forward multiples during strong demand cycles. The key judgment is whether the growth persists long enough to justify paying up — and the 307-GW backlog plus grid and reshoring drivers argue that it does.
Step-by-step base case. Applying a 29.4x forward multiple to $15.80 of forward EPS yields a fair value of approximately $465 (29.4 × $15.80 ≈ $464.5). That is about 12% above the current price and sits just below the analyst consensus target of $469.95. I broadly agree with the consensus rather than exceeding it: the growth and margin story is excellent, but the entry multiple already embeds much of it, so I want a margin of safety rather than to assume peak multiple expansion.
Scenario analysis.
Scenario Forward multiple on $15.80 EPS Implied price vs. $415.20 Bull ~33x ~$521 +25% Base ~29.4x ~$465 +12% Bear ~22x ~$348 −16%
The bull case (~$521, above Morgan Stanley’s $500 Overweight target) assumes the data-center supercycle accelerates, margins reach or exceed the top of guidance, and the market awards a peak multiple to durable double-digit growth. The base case (~$465) assumes guidance is met and the multiple holds near current levels. The bear case (~$348) assumes data-center order growth decelerates, multiple compression sets in, and Eaton de-rates toward a more typical industrial multiple — a real risk given how much good news is priced in. The asymmetry is reasonable but not extreme: roughly 12% base-case upside with ~25% in the bull case against ~16% downside.
Comparison to consensus. Consensus rates Eaton a Buy with an average target near $470, and the most bullish major desk (Morgan Stanley) is at $500. My $465 base target is deliberately a touch below consensus — I agree on direction and quality but respect the valuation, which is the single biggest reason this is a Buy rather than a Strong Buy.
—
6. Risk Factors
Risk 1 — Valuation and multiple compression. The most immediate risk is not operational but valuation. At ~26x forward earnings and ~8x book value, Eaton is priced for continued double-digit growth and ongoing margin expansion. If either falters — even temporarily — the stock could de-rate sharply, because premium multiples are unforgiving. A move from ~26x to a more historically average ~20x forward multiple, with no change in earnings, would take the stock down more than 20%. Investors buying today are paying for a great business at a full price, which means the entry point carries as much risk as the fundamentals. This is why position sizing and a disciplined entry range matter more here than for a cheaper stock.
Risk 2 — Data-center order cyclicality and AI-capex digestion. Much of Eaton’s recent acceleration is tied to the AI-driven data-center buildout. That backlog is enormous, but capital-spending cycles are cyclical, and hyperscaler capex plans can be revised. If AI infrastructure spending pauses to digest prior investment — as capex cycles historically do — Eaton’s order growth could decelerate meaningfully even if the long-term trajectory stays intact. The 65% data-center growth rate is spectacular precisely because it is running well above the ~23% market rate; such gaps tend to normalize. A slowdown wouldn’t break the multi-year thesis, but it could easily break the stock in the near term by puncturing the growth narrative the current multiple depends on.
Risk 3 — Margin, competition, and integration risk. Eaton’s margin expansion is a core pillar of the bull case, and it is exposed on several fronts. Input-cost inflation (copper, steel, electronics), supply-chain disruption, or a mix shift back toward lower-margin segments could stall margin gains. Meanwhile, the attractive economics of data-center power are drawing aggressive capacity investment from Schneider, Vertiv, and ABB, which could pressure industry pricing over time. Finally, Eaton is actively acquiring (Boyd Thermal and others) to extend its reach; acquisitions add integration risk and, if they underperform, could dilute returns and complicate the clean margin-expansion story. None of these is likely to be catastrophic, but any of them could turn a beat-and-raise cadence into a miss, which the current valuation would punish.
—

7. Conclusion & Exit Plan
Eaton is a high-quality industrial compounder sitting at the intersection of several of the most durable demand trends of the decade — AI-driven data-center power, grid modernization, reshoring, and aerospace recovery. The Q2 2026 results, with 21.4% revenue growth, 65% data-center organic growth, and another guidance raise, confirm that the electrification supercycle is translating directly into Eaton’s earnings. Operating margins have expanded roughly 460 basis points in three years, free cash flow has nearly doubled, and the 307-GW data-center backlog gives unusually long visibility. The single meaningful reservation is valuation: at ~26x forward earnings, a great deal of good news is already in the price.
Investment rating: Buy. (Not Strong Buy — the quality warrants ownership, but the full valuation argues for discipline on entry.)
Entry price range. I would look to build a position on weakness toward the $370–$400 range, which would bring the forward multiple back toward ~24x and improve the risk/reward. At the current $415, a partial starter position is reasonable for long-term investors, with the intent to add on pullbacks. Chasing strength above the 52-week high near $437 is where I would be most cautious.
Exit conditions.
– Target achieved: trim into strength as the stock approaches the $465 base-case target; take further profits if it reaches the $520 bull-case level.
– Fundamental break: reduce or exit if data-center order growth turns negative for two consecutive quarters, or if segment margins reverse and decline below ~22% for two consecutive quarters — either would invalidate the growth-plus-margin thesis that justifies the premium multiple.
– Time-based: reassess the full thesis in 12 months, or immediately after any quarter in which backlog shrinks year over year.
Summary table
Item Detail Company Eaton Corporation plc (ETN) Current Price $415.20 Target Price $465 (base case) Upside ~12% Rating Buy Key Thesis Electrification + AI data-center power supercycle driving accelerating double-digit growth and margin expansion Main Risk Rich ~26x forward valuation vulnerable to multiple compression if data-center order growth decelerates
—
Disclaimer:
This content is general investment information provided to an indefinite/unspecified audience by a quasi-investment advisory business registered under Korea’s Financial Investment Services and Capital Markets Act, and is not personalized 1:1 investment advice tailored to any individual investor. This analysis is for informational purposes only and is not a solicitation to invest. All investment decisions and their consequences rest solely with the investor. The estimates and assumptions in this report are as of the writing date (2026-08-02) and may not materialize depending on market conditions and geopolitical variables. Financial data used reflects sources such as company filings and analyst consensus, and the scenarios and price targets represent the author’s conservative assessment. All investments carry the risk of principal loss, and past performance or analytical track record does not guarantee future results. As of the writing date, the author does not hold a position in this stock. The author’s holdings and positions may change without prior notice depending on market conditions.
함께 읽으면 좋은 글
- Oceaneering International (OII) Navy XLUUV Award: Why We Still Trim a $48.78 Stock Analysts Value at $38.50 [2026년 08월 재분석]
- Intuitive Surgical da Vinci 5 Procedure Growth Fears: Why a 40%+ Selloff Hands Long-Term Investors a Wide-Moat Compounder at 29x Forward Earnings
- Apple Siri AI Supercycle Stock Reanalysis [July 2026]: AAPL Hit Its $304 Target — Here’s the Path to $388
- Nasdaq (NDAQ) FinTech Re-Rating Thesis: Why $3.3 Billion in Recurring Revenue Points to 15%+ Upside
- Verisk Analytics Growth Reacceleration: Why the Q1 2026 Trough and a 45% P&C Data Moat Point to a Path Back to $235