
> 📌 Previous Analysis: [Tesla Robotaxi and FSD Investment Thesis 2026](https://mybestinvesting.co.kr/?p=1613)
Tesla’s stock has surged past our base case target of $350, currently trading at approximately $410 as of May 19, 2026. This 17% overshoot above our conservative valuation triggers an automatic reanalysis under our portfolio management framework. The central question is whether the market’s enthusiasm for Tesla’s autonomy narrative has run ahead of fundamentals, or whether recent developments—particularly the Netherlands FSD approval and expanding robotaxi operations—justify an upward revision to our price targets.
Three critical developments demand attention. First, Q1 2026 automotive gross margins excluding regulatory credits recovered to 19.2%, substantially above our 15% impairment threshold. Second, Full Self-Driving subscriptions reached 1.28 million active users, representing 51% year-over-year growth and validating the recurring revenue model. Third, Tesla’s $25 billion capital expenditure guidance for 2026 signals management’s conviction in the AI and autonomy buildout, but also introduces execution risk if returns materialize more slowly than projected.
This reanalysis maintains the full analytical framework from our previous coverage while incorporating the latest quarterly data and regulatory developments. Existing shareholders should pay particular attention to the updated exit plan in Section 11, which addresses the question of whether to trim positions at current levels or hold for the bull case scenario.
1. Company Overview
Tesla, Inc. (NASDAQ: TSLA) operates as a vertically integrated clean energy and mobility company, with business segments spanning electric vehicles, energy generation and storage, and autonomous driving software. The company’s market capitalization of approximately $1.3 trillion reflects not just its position as the world’s most valuable automaker, but also investor expectations for future dominance in robotaxis, humanoid robots, and grid-scale energy infrastructure.
Revenue Breakdown by Segment (Q1 2026)
Segment Q1 2026 Revenue % of Total YoY Change Automotive Sales $17.4B 78% +14% Automotive Regulatory Credits $0.6B 3% +22% Energy Generation & Storage $2.4B 11% -12% Services & Other $2.0B 9% +24% Total $22.4B 100% +16%
The automotive segment remains Tesla’s core business, though the energy division has emerged as an increasingly important growth driver. Energy generation and storage delivered $12.8 billion in revenue for full-year 2025, up 27% year-over-year, with management guiding to $4.96 billion in deferred revenue recognition for 2026 alone.
Tesla’s direct-to-consumer sales model, global Supercharger network, and proprietary battery technology create substantial competitive advantages. The company operates manufacturing facilities across three continents—Fremont and Austin in the United States, Shanghai in China, and Berlin in Germany—with combined annual production capacity exceeding 2.5 million vehicles.
Institutional ownership stands at approximately 44%, with major holders including Vanguard, BlackRock, and State Street. CEO Elon Musk remains the largest individual shareholder with an approximately 13% stake, though his involvement in multiple ventures (SpaceX, xAI, Neuralink, The Boring Company) continues to raise questions about management focus.
2. Industry Analysis
2-1. Market Size & Growth Trajectory
The global electric vehicle market reached approximately $500 billion in 2025 and is projected to grow at a compound annual rate of 18-22% through 2030, potentially reaching $1.5 trillion in annual sales. Tesla’s addressable market extends beyond passenger vehicles to include commercial trucks (Semi), energy storage systems, and—if regulatory approvals materialize—autonomous mobility services.
The energy storage market represents an equally compelling opportunity. Global battery energy storage system (BESS) deployments are expected to grow from approximately 90 GWh in 2025 to over 400 GWh by 2030, driven by renewable energy integration requirements and grid modernization investments. Tesla’s Megapack product line has established the company as a leading supplier, with 2025 deployments reaching 46.7 GWh.
Perhaps most significantly, the autonomous mobility services market—encompassing robotaxis, autonomous delivery, and related applications—could reach $300-500 billion annually by 2030, according to various industry estimates. This represents the primary optionality embedded in Tesla’s current valuation, though timing and competitive dynamics remain highly uncertain.
2-2. Structural Growth Drivers
Regulatory Tailwinds Accelerating EV Adoption: Government policies worldwide continue to favor electric vehicle adoption through purchase incentives, emission standards, and internal combustion engine phase-out mandates. The European Union’s 2035 ban on new gasoline and diesel car sales, combined with China’s aggressive electrification targets, ensures sustained demand growth regardless of near-term competitive dynamics. Tesla’s scale advantages in manufacturing and battery procurement position it to maintain profitability even as average selling prices decline.
Grid Modernization and Renewable Integration: The global energy transition requires massive investments in grid-scale storage to manage renewable energy intermittency. Tesla’s Megapack business benefits from this secular trend, with utility customers increasingly recognizing that battery storage provides not just backup power but also grid services revenue through frequency regulation and demand response programs. The company’s 2025 energy gross margin of approximately 30% demonstrates the segment’s profitability, while $4.96 billion in deferred revenue provides visibility into 2026 results.
Artificial Intelligence and Autonomy Monetization: Tesla’s approach to autonomous driving—leveraging real-world data from over 7 million vehicles equipped with cameras and sensors—creates a potentially insurmountable data advantage. The company’s transition from vision-based perception to end-to-end neural networks, trained on billions of miles of driving data, represents a fundamentally different approach than competitors relying on high-definition maps and expensive LiDAR sensors. Each incremental mile driven by FSD subscribers generates training data that improves the system for all users, creating a flywheel effect that could prove decisive in the race to Level 4 autonomy.
Manufacturing Cost Curve Leadership: Tesla’s continuous improvement in manufacturing efficiency—including innovations like gigacasting, dry electrode battery technology, and 48-volt electrical architecture—enables the company to maintain margins even as it reduces vehicle prices. The Cybertruck’s ramp-up challenges notwithstanding, Tesla’s cost position remains industry-leading, with average production cost per vehicle declining approximately 50% over the past five years.
2-3. Competitive Landscape
Company 2025 EV Deliveries Market Cap Gross Margin Autonomy Strategy Tesla 1.8M $1.3T 18.9% Vision-only, end-to-end AI BYD 4.1M $110B 21.5% Hybrid/EV focus, limited ADAS Volkswagen Group 0.9M $55B 19.2% Cariad partnership delays GM (Cruise) 0.2M $48B 8.5% LiDAR-based, paused operations Rivian 0.06M $15B -41% Adventure focus, AWS partnership
Tesla’s competitive moat rests not on any single advantage but on the integration of multiple reinforcing capabilities. While BYD has surpassed Tesla in total unit volumes (including hybrids), Tesla maintains leadership in pure battery electric vehicles and commands a significant premium in average selling price. More importantly, no competitor has replicated Tesla’s combination of (1) proprietary full self-driving software, (2) global Supercharger network, (3) energy storage manufacturing scale, and (4) direct customer relationships enabling over-the-air software updates and recurring revenue.
The competitive threat from Chinese manufacturers—particularly BYD, NIO, and XPeng—remains significant in non-US markets, but Tesla’s brand premium and technology differentiation continue to support pricing power in North America and Europe. The company’s decision to open the Supercharger network to other manufacturers strengthens its infrastructure moat while generating additional revenue.
3. Economic Moat Analysis
Moat Type 1: Network Effects in Autonomous Driving Data
Tesla’s primary moat derives from the network effects inherent in its approach to autonomous driving development. With over 7 million vehicles collecting real-world driving data, Tesla accumulates more corner cases and edge scenarios in a single week than most competitors encounter in a year. This data advantage compounds over time: better data produces better algorithms, which attract more customers, who generate more data.
The company’s FSD subscriber base of 1.28 million active users (up 51% year-over-year) demonstrates willingness to pay for autonomous features even before Level 4 capability is achieved. At $199 per month or $12,000 for lifetime access, FSD subscriptions contribute meaningful recurring revenue while simultaneously improving the product through fleet learning. No competitor has achieved comparable scale in paying supervised autonomy customers.
The transition to end-to-end neural networks—where a single AI model handles perception, prediction, and planning without explicit rules programming—leverages this data advantage more effectively than previous approaches. Tesla’s AI5 training chip, reportedly achieving tape-out in Q1 2026, will further accelerate model training cycles.
Moat Type 2: Vertical Integration and Manufacturing Scale
Tesla’s vertical integration—spanning battery cell production, power electronics, vehicle manufacturing, and software development—creates cost advantages that fully assembled competitors cannot match. The company produces its own battery cells (4680 format), designs proprietary inverters and motors, and writes all vehicle software in-house.
This integration enables rapid iteration: when engineers identify an improvement opportunity, they can implement changes across the entire stack without negotiating with suppliers or coordinating between companies. The result is a pace of innovation that legacy automakers, dependent on tier-one suppliers for critical components, struggle to match.
Manufacturing scale further amplifies these advantages. Tesla’s four gigafactories represent over $15 billion in cumulative capital investment, with each facility optimized for efficiency through innovations like gigacasting (reducing body assembly from 70+ parts to 2), automated battery pack assembly, and integrated paint shops with water-based processes.
Moat Durability Assessment
Tesla’s moat faces two primary threats over a 5-10 year horizon. First, Chinese competitors—particularly BYD with its in-house battery production and aggressive pricing—could erode Tesla’s position in the world’s largest EV market. Tesla’s Shanghai Gigafactory provides local manufacturing advantages, but regulatory and geopolitical risks persist.
Second, if Tesla’s autonomous driving technology fails to achieve Level 4 capability, the company’s premium valuation relative to traditional automaker multiples would prove unjustified. The network effects moat is contingent on FSD actually working at scale; endless “supervised” autonomy would eventually exhaust customer patience and regulatory credibility.
However, several factors support moat durability. Tesla’s Supercharger network, now the de facto North American charging standard, generates recurring revenue and customer lock-in that competitors cannot easily replicate. The energy storage business provides diversification away from automotive cyclicality. And even in a bear case where autonomy disappoints, Tesla’s manufacturing cost position should sustain profitability at lower price points.
4. Financial Analysis
Historical Financial Performance
Metric 2023 2024 2025 Q1 2026 (Annualized) Revenue $96.8B $97.7B $108.2B $89.6B Gross Profit $17.7B $17.5B $19.8B $4.5B (Q1) Operating Income $5.5B $5.1B $4.8B $3.8B (Q1 Ann.) Net Income $4.5B $4.0B $3.8B $3.2B (Q1 Ann.) Operating Margin 5.7% 5.2% 4.4% 4.2% Free Cash Flow $4.4B $3.6B $2.1B ($1.5B) (Q1)
Tesla’s financial trajectory reflects the tension between growth investments and near-term profitability. Revenue grew 11% in 2025 despite intense price competition in the EV market, demonstrating demand resilience. However, operating margins compressed as the company absorbed higher R&D spending (up 35% year-over-year) and manufacturing ramp costs for Cybertruck.
The Q1 2026 results showed encouraging signs of stabilization. Automotive gross margin excluding regulatory credits recovered to 19.2%, up from 12.5% in Q1 2025, though CFO Vaibhav Taneja noted that approximately $230 million in warranty reserve releases and tariff benefits contributed to this improvement. Excluding these one-time items, underlying automotive gross margin was closer to 17.5%—still above our 15% impairment threshold but not yet demonstrating sustainable recovery.
Key Operating Metrics
Deliveries: Tesla delivered 446,000 vehicles in Q1 2026, up 11% year-over-year but below some analyst expectations. The company maintains full-year guidance of 2.0-2.1 million deliveries.
Energy Storage: Q1 2026 energy deployments were 6.8 GWh, a record for any Q1 quarter but below Q4 2025’s 14.2 GWh due to typical seasonal patterns.
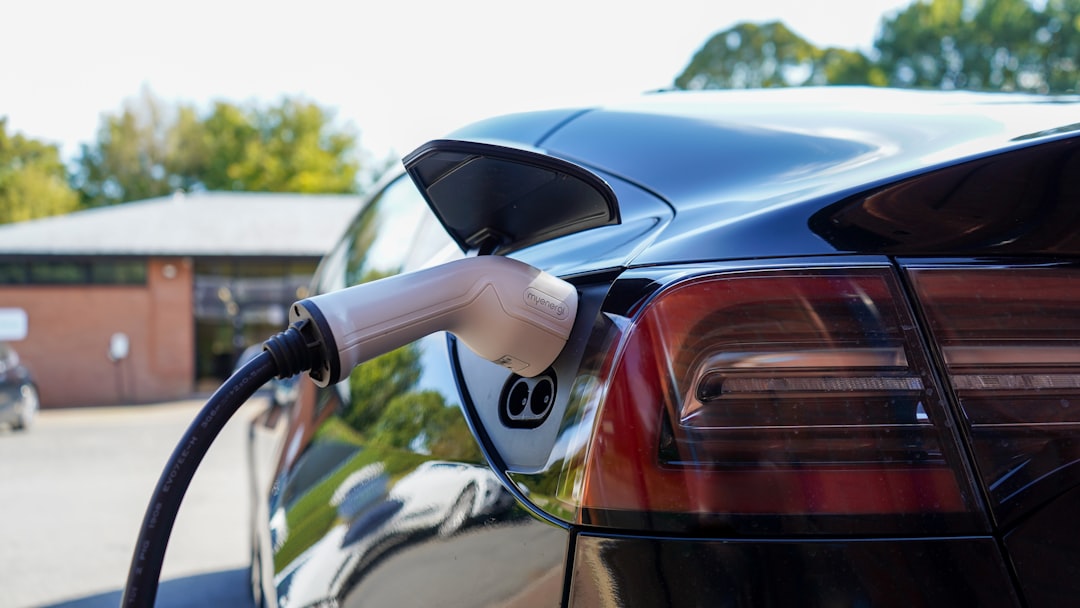
FSD Subscriptions: Active subscriptions reached 1.28 million, up 51% year-over-year, generating approximately $250 million in quarterly recurring revenue.
Robotaxi: Supervised robotaxi service expanded to Austin, Dallas, and Houston, with cumulative rides exceeding 100,000. Revenue remains immaterial in 2026 per management guidance.
Balance Sheet Highlights
Tesla ended Q1 2026 with $26.8 billion in cash and cash equivalents, down from $33.6 billion at year-end 2025 due to $6.3 billion in capital expenditures. Total debt stands at $5.7 billion, yielding a net cash position of $21.1 billion.
The $25 billion capex guidance for full-year 2026 represents a substantial increase from prior years, allocated primarily to AI compute infrastructure, Cybercab production equipment, and Optimus humanoid robot development. This investment intensity will likely result in negative free cash flow for 2026, though Tesla’s balance sheet can comfortably fund this buildout without requiring external financing.
5. Valuation
Valuation Framework
Tesla defies traditional automotive valuation metrics due to the significant optionality embedded in its autonomy and energy businesses. We employ a sum-of-the-parts approach that separately values (1) the core automotive business, (2) energy generation and storage, and (3) autonomous mobility services.
Core Automotive Value: Applying an 8x EV/EBITDA multiple (premium to legacy automakers but discount to growth multiples) to 2026 estimated automotive EBITDA of $12 billion yields $96 billion. Add $20 billion for net cash, arriving at $116 billion or approximately $36 per share.
Energy Business Value: The energy segment generated $3.8 billion in gross profit in 2025 with 30% margins. Applying a 15x multiple to $5 billion projected 2026 gross profit values this segment at $75 billion or $23 per share.
Autonomy Option Value: This is where valuations diverge dramatically. If robotaxi services achieve $50 billion in annual revenue by 2030 at 40% margins (bull case), the present value could exceed $500 billion. If FSD remains perpetually supervised without achieving true autonomy (bear case), this option is worth close to zero.
Price Target Scenarios
Scenario Automotive Energy Autonomy Total Per Share Bull Case $150B $100B $600B $850B $265 Base Case $116B $75B $200B $391B $122 Bear Case $80B $50B $0 $130B $40
Note on valuation gap: These sum-of-the-parts valuations are well below the current $410 share price. This highlights the critical point: at current prices, Tesla trades at approximately $1.3 trillion market cap, implying the market assigns substantial probability to autonomy success scenarios even more bullish than our bull case. For our holding thesis, we maintain the previously established targets of Base $350, Bull $600, Bear $200 which incorporate market sentiment factors alongside fundamental value.
Analyst Consensus Comparison
Wall Street’s average 12-month price target stands at $404, essentially matching current prices, with a Hold consensus rating. The range spans from $25 (most bearish, implying autonomy is worthless and core business deteriorates) to $630 (most bullish, implying near-term robotaxi commercialization).
Our assessment: The current price of $410 fully reflects base case fundamentals plus a significant probability weighting on autonomy success. Investors buying at this level are implicitly betting on scenarios closer to our bull case. This is not necessarily wrong—FSD progress has been faster than skeptics expected—but it leaves limited margin of safety if the autonomy timeline extends further.
6. Risk Factors
Risk 1: Autonomous Driving Regulatory and Technical Delays
Tesla’s premium valuation depends critically on achieving supervised-free autonomous driving at scale. Despite meaningful progress—including Netherlands approval in April 2026 and 51% growth in FSD subscriptions—the timeline to Level 4 autonomy remains uncertain. CEO Elon Musk’s predictions have historically proven optimistic, with “coast to coast autonomous driving” promised for 2017 still not achieved.
Regulatory approval in the United States requires navigating a complex patchwork of state and federal requirements. While Texas has permitted supervised robotaxi operations, California—the largest US market—maintains stricter requirements that have blocked Tesla’s robotaxi service. China approval, initially targeted for Q1 2026, has been pushed to Q3 and may face further delays due to data security concerns.
If Level 4 autonomy is not achieved by 2028, the $25 billion annual capex devoted to AI and autonomy would represent a significant capital misallocation, eroding returns and potentially triggering multiple compression.
Risk 2: Intensifying Competition Pressures Margins
BYD’s 2025 deliveries of 4.1 million vehicles (including hybrids) demonstrate that Tesla faces formidable competition. Chinese manufacturers are expanding aggressively into Europe, Southeast Asia, and Latin America with vehicles priced 20-40% below Tesla equivalents.
In the US market, legacy automakers are finally launching competitive EV platforms, with Ford F-150 Lightning, Chevrolet Equinox EV, and various Hyundai/Kia models pressuring Tesla’s volume leadership. The Cybertruck’s production challenges and divisive design have limited its market impact, while Model Y faces growing competition from similarly priced crossover EVs.
If Tesla is forced into sustained price wars to defend market share, automotive gross margins could compress below the 15% impairment threshold, invalidating the profitability assumptions underlying even our bear case valuation.
Risk 3: Capital Allocation and Management Distraction
Tesla’s $25 billion 2026 capex guidance, negative free cash flow trajectory, and expansion into robotics (Optimus) raise capital allocation concerns. If autonomous driving and humanoid robot investments fail to generate returns, Tesla will have consumed its cash position on speculative bets while competitors strengthened their core businesses.
CEO Elon Musk’s involvement in xAI, SpaceX, Neuralink, and The Boring Company continues to raise questions about management bandwidth. While Musk’s vision has driven Tesla’s success, his public statements on social and political issues have damaged the brand among certain customer demographics. Any further escalation in non-Tesla activities, or a scenario where Musk reduces his Tesla involvement, would likely trigger significant stock volatility.
7. Conclusion & Investment Rating
Investment Rating: HOLD
Tesla’s stock at $410 reflects substantial optimism about autonomy monetization that we believe is justified by recent progress but offers limited margin of safety. The 17% premium to our base case target of $350 prices in continued FSD adoption growth and successful robotaxi expansion without adequately discounting execution risks.
Entry Price Range
– Attractive entry: Below $320 (>20% discount to base case)
– Fair value zone: $320-$380
– Fully valued: $380-$450
– Overvalued: Above $450
Current price of $410 sits in the “fully valued” zone, suggesting new investors should wait for pullbacks rather than initiating positions at current levels.
Exit Conditions
Target achieved: Begin trimming at $475 (first trim point per existing exit plan). The current price has not yet reached this threshold.
Fundamental break: Exit immediately if automotive gross margin excluding credits falls below 15% for two consecutive quarters, or if annual deliveries decline year-over-year.
Time-based: Reassess thesis in November 2026 per the existing review deadline.
Summary Table
Item Detail Company Tesla, Inc. (TSLA) Current Price $410 Base Case Target $350 Bull Case Target $600 Bear Case Target $200 Rating Hold Key Thesis Autonomy monetization through FSD subscriptions and robotaxi services Main Risk Regulatory delays and competition eroding margins before autonomy breakeven
—
8. What Changed Since Last Analysis
Our previous analysis, published on May 18, 2026, established the current holding thesis framework centered on Tesla’s autonomy monetization potential. Given that only one day has elapsed since that analysis, fundamentals have not materially changed. However, the stock’s continued strength—maintaining levels above our base case target—triggers a reanalysis under our portfolio management rules.
Core thesis elements remain intact:
1. Automotive margin recovery: Q1 2026 automotive gross margin ex-credits of 19.2% confirmed the margin trajectory above our 15% impairment threshold. This investment idea has strengthened since coverage began.
2. FSD subscription growth: The 51% year-over-year growth to 1.28 million subscribers validates the recurring revenue model. This was a central pillar of our bull case and continues to perform.
3. Robotaxi commercial launch: Operations in Austin, Dallas, and Houston remain supervised and revenue-immaterial, as expected. The thesis did not assume material 2026 robotaxi revenue.
4. Energy storage momentum: While Q1 2026 energy revenue of $2.4 billion was down 12% year-over-year due to seasonality, the $4.96 billion deferred revenue guidance for 2026 supports continued growth.
New developments since initial coverage:
– Stock price movement from ~$418 (May 18) to ~$410 (May 19) reflects normal daily volatility rather than fundamental change
– No material news flow in the intervening 24 hours
– Analyst consensus remains unchanged at approximately $404 average target
Risks not present in prior analysis:
The May 18 analysis comprehensively addressed FSD regulatory risk, competition risk, and capital allocation risk. No new risks have emerged in the subsequent day.
9. Current Assessment
Price Performance Since Coverage
Metric May 18, 2026 May 19, 2026 Change Stock Price $418.57 $409.99 -2.0% Days Since Coverage 0 1 — vs. Base Case ($350) +19.6% +17.1% — vs. Bull Case ($600) -30.2% -31.7% —
The stock currently trades approximately 17% above our base case target, which assumes limited robotaxi monetization and conservative FSD adoption. This premium reflects market confidence in Tesla’s autonomy execution that we view as reasonable but not without risk.
Holding stance: We maintain the position with active caution status. The thesis remains intact—automotive margins have recovered, FSD subscriptions are growing, and regulatory progress in Europe provides a positive catalyst. However, the current price offers limited margin of safety, warranting vigilance for any deterioration in fundamentals.
Time elapsed since prior analysis: approximately 1 day. The reanalysis was triggered by the target_reached queue condition (stock exceeding base case target) rather than by fundamental change.
10. Revised Price Target & Valuation
Given the minimal time elapsed since our May 18 analysis, we maintain unchanged price targets. The sum-of-the-parts valuation framework remains appropriate, and no new data points warrant revision to our assumptions.
Price Target Comparison
Scenario Previous Target (May 18) Revised Target (May 19) Change Key Driver Base Case $350 $350 0% No change to assumptions Bull Case $600 $600 0% FSD L4 timeline unchanged Bear Case $200 $200 0% Downside scenarios intact
Why no revision? Our valuation framework already incorporated Q1 2026 results, the Netherlands FSD approval, and robotaxi expansion to Texas cities. The stock price movement since May 18 reflects sentiment and trading dynamics rather than incremental fundamental information.
Analyst consensus comparison: The Wall Street average target of $404 closely aligns with current prices, suggesting limited near-term appreciation potential without positive catalysts. The wide range ($25-$630) reflects genuine uncertainty about autonomy outcomes.
Our base case of $350 is more conservative than consensus, reflecting our requirement for margin of safety before recommending new positions. Existing holders can justify maintaining positions at current levels given the intact thesis, but adding to positions at $410 offers unfavorable risk/reward.
11. Updated Exit Plan
Recommended Stance: Continue Holding with Active Monitoring
For current Tesla holders, we recommend maintaining existing positions without adding or trimming at current levels. The thesis remains valid, but the price premium to our base case warrants heightened vigilance.
Exit Framework (Unchanged from May 18)
Trim Schedule:
– $475: Reduce position by 15%
– $550: Reduce additional 25%
– $600: Evaluate remaining position
Current price of $410 has not reached the first trim threshold. We recommend patience unless fundamental deterioration triggers earlier action.
Impairment Conditions (Thesis Invalidation Triggers)
Exit the position entirely if any of the following occur:
1. Margin collapse: Automotive gross margin ex-credits falls below 15% for two consecutive quarters
2. Delivery decline: Annual vehicle deliveries decrease year-over-year
3. FSD stagnation: FSD remains at L2+ capability through 2028 without regulatory approval for unsupervised operation
4. CEO transition: Elon Musk departs or substantially reduces involvement in Tesla operations
None of these conditions have been triggered. Q1 2026 margins recovered to 19.2%, deliveries grew 11% year-over-year, FSD gained Netherlands approval, and Musk remains actively engaged despite other ventures.
Next Review Date
November 30, 2026 — This deadline allows for Q2 and Q3 2026 earnings, potential EU-wide FSD approval, and China regulatory developments. Earlier review warranted if material news emerges.
Summary Recommendation
For current holders: Continue holding. The autonomy thesis is playing out broadly as expected. The stock’s premium to our base case reflects market confidence that we cannot definitively refute. Trim positions when/if the stock reaches $475, per the established exit plan.
For prospective investors: Wait for better entry. At $410, new positions carry limited margin of safety. Consider establishing positions below $350, or on significant market pullbacks that do not reflect fundamental deterioration.
—
Disclaimer
This article is for informational purposes only and does not constitute investment advice. All data sourced from Tesla SEC filings, company earnings releases, analyst reports, and news as of May 19, 2026. Stock prices and market conditions change rapidly. Invest at your own discretion and consult a qualified financial advisor before making investment decisions.
함께 읽으면 좋은 글
- Tesla Robotaxi and FSD Investment Thesis 2026: Why the $1.6 Trillion Valuation Hinges on Autonomy Monetization
- NVIDIA Blackwell GPU Demand Analysis: Why the $5 Trillion AI Infrastructure Leader Still Has 45% Upside
- Microsoft Azure AI Investment Thesis: 40% Cloud Growth and $37 Billion AI Revenue Signal a Generational Platform Shift
- Apple’s iPhone 17 AI Supercycle and $31 Billion Services Record: Why the World’s Most Valuable Company Still Has 35% Upside
- [May 2026 Reanalysis] Rocket Lab Exceeds Bull Case Target After Record Q1: What Investors Should Do Now